Global Advertising Market, By Platform, By Add Format, By Industry Vertical, By Region & Segmental Insights Trends and Forecast, 2024 – 2034

  • Industry: Technology
  • Report ID: TNR-110-1117
  • Number of Pages: 420
  • Table/Charts : Yes
  • June, 2024
  • Base Year : 2024
  • No. of Companies : 10+
  • No. of Countries : 29
  • Views : 10064
  • Covid Impact Covered: Yes
  • War Impact Covered: Yes
  • Formats : PDF, Excel, PPT

The advertising market is thriving, driven by digital transformation and data analytics. With global ad spending projected to grow, digital advertising dominates, fueled by social media, mobile usage, and programmatic advertising. Opportunities abound in personalized and interactive ads, leveraging AI and machine learning to target consumers effectively. Video and influencer marketing are also booming, capturing audience attention and engagement. Emerging trends include the rise of connected TV (CTV), augmented reality (AR) ads, and sustainable, socially responsible advertising. Brands are focusing on creating immersive, relevant experiences while respecting privacy concerns. The shift towards omnichannel strategies ensures a cohesive consumer journey across multiple platforms, reflecting the market’s dynamic and innovative nature. In Terms of Revenue, the Global Advertising Market was Worth US$ 717.4 Bn in 2023, Anticipated to Witness CAGR of 5.4% During 2024 – 2034.

Trends in the Global Advertising Market

  • Rise of Programmatic Advertising: Programmatic advertising, which uses automated processes and algorithms to purchase ad space, is revolutionizing the global advertising market. This trend enables advertisers to target specific audiences more precisely and efficiently, resulting in higher ROI. Programmatic ads leverage vast amounts of data, including user behavior, demographics, and real-time analytics, to serve personalized and relevant ads to users. This method also allows for real-time bidding, ensuring that ad space is bought and sold at optimal prices. As a result, programmatic advertising is becoming a dominant force, offering scalability and enhanced performance. Brands can now reach their audiences across various digital channels seamlessly, making their campaigns more effective and cost-efficient.
  • Growth of Video and Connected TV (CTV) Advertising: Video and Connected TV (CTV) advertising are experiencing significant growth, transforming how brands engage with consumers. With the proliferation of streaming services and on-demand content, advertisers are shifting budgets towards video ads that run on platforms like YouTube, Hulu, and Netflix. CTV advertising allows for highly targeted and interactive ads that capture viewers’ attention in a more immersive environment. The rise of smart TVs and OTT (over-the-top) devices has expanded the reach and effectiveness of these ads. Moreover, advancements in measurement and attribution technologies are enabling advertisers to track the impact of CTV campaigns accurately. This trend highlights the increasing importance of high-quality, engaging video content in reaching today’s digitally-savvy audiences.

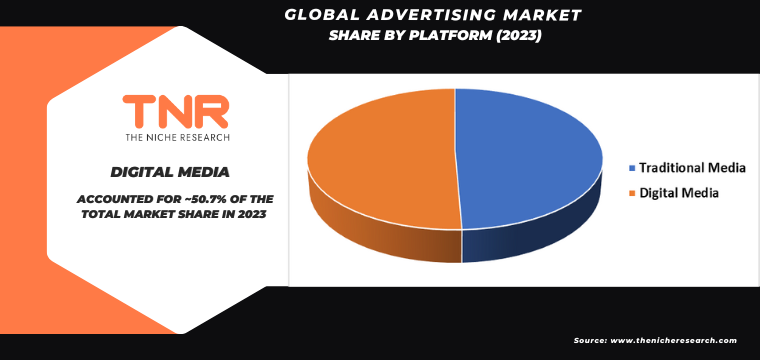
Digital media platforms have captured a substantial share of the global advertising market, driven by their ability to reach targeted audiences with precision and scale. Social media giants like Facebook, Instagram, and TikTok, along with search engines like Google, dominate ad spending due to their extensive user bases and sophisticated data analytics capabilities. These platforms offer various ad formats, including display, video, and native ads, allowing brands to engage users in diverse and interactive ways. The rise of mobile usage further amplifies digital media’s influence, with mobile advertising becoming a key revenue driver. Innovations in artificial intelligence and machine learning enhance targeting and personalization, ensuring that ads resonate with specific audiences, thereby boosting engagement and conversion rates.

In 2023, image-based advertising has emerged as the second-largest ad format in the global advertising market. This format’s popularity is driven by its visual appeal and ability to quickly convey messages, making it highly effective for brand awareness and engagement. Platforms like Instagram, Pinterest, and Facebook capitalize on image ads, leveraging their visually-driven interfaces to captivate users. High-quality images can communicate brand identity, evoke emotions, and drive consumer actions, especially when combined with compelling calls-to-action. Additionally, advancements in technology, such as augmented reality (AR) and interactive image ads, enhance user interaction and experience. The growth of e-commerce and visual search also boosts the demand for image ads, as consumers increasingly rely on visual content to inform purchasing decisions.

The entertainment and media segment within the industry vertical of the global advertising market is positioned for remarkable growth, expected to capture a substantial revenue market share of 13.1% throughout the forecast period. This surge is fuelled by several factors, including the proliferation of digital platforms, streaming services, and the increasing demand for engaging content. Advertisers are drawn to this segment due to its ability to reach highly engaged audiences across various channels, including television, streaming platforms, podcasts, and social media. Moreover, advancements in technology enable targeted advertising, personalized content delivery, and interactive experiences, enhancing the effectiveness of campaigns within this segment. As consumers continue to prioritize entertainment and media consumption, advertisers are capitalizing on this trend, driving significant growth opportunities in the industry.

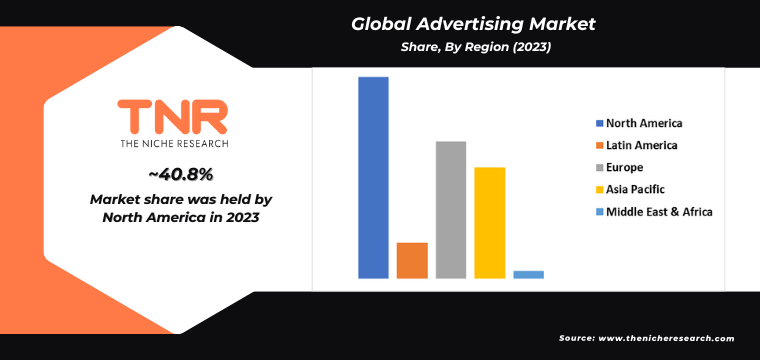
In 2023, North America asserted its dominance in the advertising market, emerging as the leading region in terms of advertising expenditure and market share. This stronghold can be attributed to several factors, including the region’s robust economy, high levels of consumer spending, and advanced digital infrastructure. North America boasts a diverse media landscape, encompassing traditional outlets such as television, radio, and print, as well as digital platforms like social media, search engines, and streaming services. Furthermore, the presence of major tech and advertising companies headquartered in North America contributes to the region’s advertising prowess. Advertisers are drawn to the region’s affluent and tech-savvy population, offering ample opportunities to target and engage with diverse demographics. As a result, North America continues to lead the global advertising market, setting trends and driving innovation in the industry.

Competitive Landscape

Some of the players operating in the advertising market are

  • Dentsu Inc.
  • DIGITAS
  • GroupM
  • Havas
  • IPG
  • Omnicom Group Inc.
  • Publicis Groupe
  • R. Donnelley & Sons Company
  • Weber Shandwick
  • WPP Group PLC
  • Other Industry Participants

Global Advertising Market Scope

Report Specifications Details
Market Revenue in 2023 US$ 717.4 Bn
Market Size Forecast by 2034 US$ 1,279.4 Bn
Growth Rate (CAGR) 5.4%
Historic Data 2016 – 2022
Base Year for Estimation 2023
Forecast Period 2024 – 2034
Report Inclusions Market Size & Estimates, Market Dynamics, Competitive Scenario, Trends, Growth Factors, Market Determinants, Key Investment Segmentation, Product/Service/Solutions Benchmarking
Segments Covered By Platform, By Add Format, By Industry Vertical, By Region
Regions Covered North America, Europe, Asia Pacific, Middle East & Africa, Latin America
Countries Covered U.S., Canada, Mexico, Rest of North America,  France, The UK, Spain, Germany, Italy, Nordic Countries (Denmark, Finland, Iceland, Sweden, Norway), Benelux Union (Belgium, The Netherlands, Luxembourg), Rest of Europe,  China, Japan, India, New Zealand, Australia, South Korea, Southeast Asia (Indonesia, Thailand, Malaysia, Singapore, Rest of Southeast Asia), Rest of Asia Pacific,  Saudi Arabia, UAE, Egypt, Kuwait, South Africa, Rest of Middle East & Africa,  Brazil, Argentina, Rest of Latin America
Key Players Dentsu Inc., DIGITAS, GroupM, Havas, IPG, Omnicom Group Inc., Publicis Groupe, R.R. Donnelley & Sons Company, Weber Shandwick, WPP Group PLC
Customization Scope Customization allows for the inclusion/modification of content pertaining to geographical regions, countries, and specific market segments.
Pricing & Procurement Options Explore purchase options tailored to your specific research requirements
Contact Details Consult With Our Expert

Japan (Toll-Free):  +81 663-386-8111

South Korea (Toll-Free):  +82-808- 703-126

Saudi Arabia (Toll-Free):  +966 800-850-1643

United Kingdom: +44 753-710-5080

United States: +1 302-232-5106

E-mail:  askanexpert@thenicheresearch.com


Global Advertising Market

By Platform

  • Traditional Media
    • Television
    • Radio
    • Print
      • Newspapers
      • Magazines
      • Others
    • Billboards
  • Digital Media
    • Online Display Ads
    • Social Media Ads
    • Search Engine Marketing (SEM)
      • Pay-per-click (PPC)
      • Display ads
      • Product Listing ads (PLAs)
    • Email Marketing
    • Programmatic Advertising
    • Over-the-Top (OTT) Advertising
    • Native ads
    • Interactive ads
    • Others

By Add Format

  • Text
  • Image
  • Video
  • Banners
  • Others

By Industry Vertical

  • Food and Beverage
  • Travel and Hospitality
  • Entertainment and Media
  • Real Estate
  • Education
  • Healthcare
  • Automotive
  • BSFI
  • Retail and Consumer Goods
  • IT and Technology
  • Others

By Region

  • North America (U.S., Canada, Mexico, Rest of North America)
  • Europe (France, The UK, Spain, Germany, Italy, Nordic Countries (Denmark, Finland, Iceland, Sweden, Norway), Benelux Union (Belgium, The Netherlands, Luxembourg), Rest of Europe)
  • Asia Pacific (China, Japan, India, New Zealand, Australia, South Korea, Southeast Asia (Indonesia, Thailand, Malaysia, Singapore, Rest of Southeast Asia), Rest of Asia Pacific)
  • Middle East & Africa (Saudi Arabia, UAE, Egypt, Kuwait, South Africa, Rest of Middle East & Africa)
  • Latin America (Brazil, Argentina, Rest of Latin America)

Report Layout:


Table of Contents

.

1.Market Scope
1.1.Market Segmentation
1.2.Years Considered
1.2.1.Historic Years: 2016 – 2022
1.2.2.Base Year: 2023
1.2.3.Forecast Years: 2024 – 2034
2.Key Target Audiences
3.Research Methodology
3.1.Primary Research
3.1.1.Research Questionnaire
3.1.2.Global Percentage Breakdown
3.1.3.Primary Interviews: Key Opinion Leaders (KOLs)
3.2.Secondary Research
3.2.1.Paid Databases
3.2.2.Secondary Sources
3.3.Market Size Estimates
3.3.1.Top-Down Approach
3.3.2.Bottom-Up Approach
3.4.Data Triangulation Methodology
3.5.Research Assumptions
4.Recommendations and Insights from TNR’s Perspective**
5.Holistic Overview of Advertising Market
6.Market Synopsis: Advertising Market
7.Advertising Market Analysis: Qualitative Perspective
7.1.Introduction
7.1.1.Product Definition
7.1.2.Industry Development
7.2.Market Dynamics
7.2.1.Drivers
7.2.2.Restraints
7.2.3.Opportunities
7.2.4.Challenges
7.3.Trends in Advertising Market
7.4.Market Determinants Radar Chart
7.5.Macro-Economic and Micro-Economic Indicators: Advertising Market
7.6.Porter’s Five Force Analysis
7.7.Impact of Covid-19 on Advertising Market
7.8.PESTEL Analysis
7.9.Value Chain Analysis
7.10.Pricing Analysis, By Region (2023)
7.10.1.North America
7.10.2.Europe
7.10.3.Asia Pacific
7.10.4.Middle East and Africa
7.10.5.Latin America
8.Global Advertising Market Analysis and Forecasts, 2024 – 2034
8.1.Overview
8.1.1.Global Advertising Market Revenue (US$ Mn)
8.2.Global Advertising Market Revenue (US$ Mn) and Forecasts, By Platform
8.2.1.Traditional Media (Definition, Market Estimation and Penetration, 2016 – 2023, Market Estimation (2016 – 2023), Market Forecast (2024 – 2034), Compound Annual Growth Rate (CAGR), Regional Bifurcation (North America, Europe, Asia Pacific, Middle East and Africa, Latin America) and Information on Television, Radio, Print, Billboards)
8.2.1.1.Television
8.2.1.2.Radio
8.2.1.3.Print
8.2.1.3.1.Newspapers
8.2.1.3.2.Magazines
8.2.1.3.3.Others
8.2.1.4.Billboards
8.2.2.Digital Media (Definition, Market Estimation and Penetration, 2016 – 2023, Market Estimation (2016 – 2023), Market Forecast (2024 – 2034), Compound Annual Growth Rate (CAGR), Regional Bifurcation (North America, Europe, Asia Pacific, Middle East and Africa, Latin America) and Information on Online Display Ads, Social Media Ads, Search Engine Marketing (SEM), Email Marketing, Programmatic Advertising, Over-the-Top (OTT) Advertising, Native ads, Interactive ads, Others)
8.2.2.1.Online Display Ads
8.2.2.2.Social Media Ads
8.2.2.3.Search Engine Marketing (SEM)
8.2.2.3.1.Pay-per-click (PPC)
8.2.2.3.2.Display ads
8.2.2.3.3.Product Listing ads (PLAs)
8.2.2.4.Email Marketing
8.2.2.5.Programmatic Advertising
8.2.2.6.Over-the-Top (OTT) Advertising
8.2.2.7.Native ads
8.2.2.8.Interactive ads
8.2.2.9.Others
8.3.Key Segment for Channeling Investments
8.3.1.By Platform
9.Global Advertising Market Analysis and Forecasts, 2024 – 2034
9.1.Overview
9.2.Global Advertising Market Revenue (US$ Mn) and Forecasts, By Add Format
9.2.1.Text
9.2.1.1.Definition
9.2.1.2.Market Estimation and Penetration, 2016 – 2023
9.2.1.3.Market Forecast, 2024 – 2034
9.2.1.4.Compound Annual Growth Rate (CAGR)
9.2.1.5.Regional Bifurcation
9.2.1.5.1.North America
9.2.1.5.1.1.Market Estimation, 2016 – 2023
9.2.1.5.1.2.Market Forecast, 2024 – 2034
9.2.1.5.2.Europe
9.2.1.5.2.1.Market Estimation, 2016 – 2023
9.2.1.5.2.2.Market Forecast, 2024 – 2034
9.2.1.5.3.Asia Pacific
9.2.1.5.3.1.Market Estimation, 2016 – 2023
9.2.1.5.3.2.Market Forecast, 2024 – 2034
9.2.1.5.4.Middle East and Africa
9.2.1.5.4.1.Market Estimation, 2016 – 2023
9.2.1.5.4.2.Market Forecast, 2024 – 2034
9.2.1.5.5.Latin America
9.2.1.5.5.1.Market Estimation, 2016 – 2023
9.2.1.5.5.2.Market Forecast, 2024 – 2034
9.2.2.Image
9.2.2.1.Definition
9.2.2.2.Market Estimation and Penetration, 2016 – 2023
9.2.2.3.Market Forecast, 2024 – 2034
9.2.2.4.Compound Annual Growth Rate (CAGR)
9.2.2.5.Regional Bifurcation
9.2.2.5.1.North America
9.2.2.5.1.1.Market Estimation, 2016 – 2023
9.2.2.5.1.2.Market Forecast, 2024 – 2034
9.2.2.5.2.Europe
9.2.2.5.2.1.Market Estimation, 2016 – 2023
9.2.2.5.2.2.Market Forecast, 2024 – 2034
9.2.2.5.3.Asia Pacific
9.2.2.5.3.1.Market Estimation, 2016 – 2023
9.2.2.5.3.2.Market Forecast, 2024 – 2034
9.2.2.5.4.Middle East and Africa
9.2.2.5.4.1.Market Estimation, 2016 – 2023
9.2.2.5.4.2.Market Forecast, 2024 – 2034
9.2.2.5.5.Latin America
9.2.2.5.5.1.Market Estimation, 2016 – 2023
9.2.2.5.5.2.Market Forecast, 2024 – 2034
9.2.3.Video
9.2.3.1.Definition
9.2.3.2.Market Estimation and Penetration, 2016 – 2023
9.2.3.3.Market Forecast, 2024 – 2034
9.2.3.4.Compound Annual Growth Rate (CAGR)
9.2.3.5.Regional Bifurcation
9.2.3.5.1.North America
9.2.3.5.1.1.Market Estimation, 2016 – 2023
9.2.3.5.1.2.Market Forecast, 2024 – 2034
9.2.3.5.2.Europe
9.2.3.5.2.1.Market Estimation, 2016 – 2023
9.2.3.5.2.2.Market Forecast, 2024 – 2034
9.2.3.5.3.Asia Pacific
9.2.3.5.3.1.Market Estimation, 2016 – 2023
9.2.3.5.3.2.Market Forecast, 2024 – 2034
9.2.3.5.4.Middle East and Africa
9.2.3.5.4.1.Market Estimation, 2016 – 2023
9.2.3.5.4.2.Market Forecast, 2024 – 2034
9.2.3.5.5.Latin America
9.2.3.5.5.1.Market Estimation, 2016 – 2023
9.2.3.5.5.2.Market Forecast, 2024 – 2034
9.2.4.Banners
9.2.4.1.Definition
9.2.4.2.Market Estimation and Penetration, 2016 – 2023
9.2.4.3.Market Forecast, 2024 – 2034
9.2.4.4.Compound Annual Growth Rate (CAGR)
9.2.4.5.Regional Bifurcation
9.2.4.5.1.North America
9.2.4.5.1.1.Market Estimation, 2016 – 2023
9.2.4.5.1.2.Market Forecast, 2024 – 2034
9.2.4.5.2.Europe
9.2.4.5.2.1.Market Estimation, 2016 – 2023
9.2.4.5.2.2.Market Forecast, 2024 – 2034
9.2.4.5.3.Asia Pacific
9.2.4.5.3.1.Market Estimation, 2016 – 2023
9.2.4.5.3.2.Market Forecast, 2024 – 2034
9.2.4.5.4.Middle East and Africa
9.2.4.5.4.1.Market Estimation, 2016 – 2023
9.2.4.5.4.2.Market Forecast, 2024 – 2034
9.2.4.5.5.Latin America
9.2.4.5.5.1.Market Estimation, 2016 – 2023
9.2.4.5.5.2.Market Forecast, 2024 – 2034
9.2.5.Others
9.2.5.1.Definition
9.2.5.2.Market Estimation and Penetration, 2016 – 2023
9.2.5.3.Market Forecast, 2024 – 2034
9.2.5.4.Compound Annual Growth Rate (CAGR)
9.2.5.5.Regional Bifurcation
9.2.5.5.1.North America
9.2.5.5.1.1.Market Estimation, 2016 – 2023
9.2.5.5.1.2.Market Forecast, 2024 – 2034
9.2.5.5.2.Europe
9.2.5.5.2.1.Market Estimation, 2016 – 2023
9.2.5.5.2.2.Market Forecast, 2024 – 2034
9.2.5.5.3.Asia Pacific
9.2.5.5.3.1.Market Estimation, 2016 – 2023
9.2.5.5.3.2.Market Forecast, 2024 – 2034
9.2.5.5.4.Middle East and Africa
9.2.5.5.4.1.Market Estimation, 2016 – 2023
9.2.5.5.4.2.Market Forecast, 2024 – 2034
9.2.5.5.5.Latin America
9.2.5.5.5.1.Market Estimation, 2016 – 2023
9.2.5.5.5.2.Market Forecast, 2024 – 2034
9.3.Key Segment for Channeling Investments
9.3.1.By Add Format
10.Global Advertising Market Analysis and Forecasts, 2024 – 2034
10.1.Overview
10.2.Global Advertising Market Revenue (US$ Mn) and Forecasts, By Industry Verticals
10.2.1.Food and Beverage
10.2.1.1.Definition
10.2.1.2.Market Estimation and Penetration, 2016 – 2023
10.2.1.3.Market Forecast, 2024 – 2034
10.2.1.4.Compound Annual Growth Rate (CAGR)
10.2.1.5.Regional Bifurcation
10.2.1.5.1.North America
10.2.1.5.1.1.Market Estimation, 2016 – 2023
10.2.1.5.1.2.Market Forecast, 2024 – 2034
10.2.1.5.2.Europe
10.2.1.5.2.1.Market Estimation, 2016 – 2023
10.2.1.5.2.2.Market Forecast, 2024 – 2034
10.2.1.5.3.Asia Pacific
10.2.1.5.3.1.Market Estimation, 2016 – 2023
10.2.1.5.3.2.Market Forecast, 2024 – 2034
10.2.1.5.4.Middle East and Africa
10.2.1.5.4.1.Market Estimation, 2016 – 2023
10.2.1.5.4.2.Market Forecast, 2024 – 2034
10.2.1.5.5.Latin America
10.2.1.5.5.1.Market Estimation, 2016 – 2023
10.2.1.5.5.2.Market Forecast, 2024 – 2034
10.2.2.Travel and Hospitality
10.2.2.1.Definition
10.2.2.2.Market Estimation and Penetration, 2016 – 2023
10.2.2.3.Market Forecast, 2024 – 2034
10.2.2.4.Compound Annual Growth Rate (CAGR)
10.2.2.5.Regional Bifurcation
10.2.2.5.1.North America
10.2.2.5.1.1.Market Estimation, 2016 – 2023
10.2.2.5.1.2.Market Forecast, 2024 – 2034
10.2.2.5.2.Europe
10.2.2.5.2.1.Market Estimation, 2016 – 2023
10.2.2.5.2.2.Market Forecast, 2024 – 2034
10.2.2.5.3.Asia Pacific
10.2.2.5.3.1.Market Estimation, 2016 – 2023
10.2.2.5.3.2.Market Forecast, 2024 – 2034
10.2.2.5.4.Middle East and Africa
10.2.2.5.4.1.Market Estimation, 2016 – 2023
10.2.2.5.4.2.Market Forecast, 2024 – 2034
10.2.2.5.5.Latin America
10.2.2.5.5.1.Market Estimation, 2016 – 2023
10.2.2.5.5.2.Market Forecast, 2024 – 2034
10.2.3.Entertainment and Media
10.2.3.1.Definition
10.2.3.2.Market Estimation and Penetration, 2016 – 2023
10.2.3.3.Market Forecast, 2024 – 2034
10.2.3.4.Compound Annual Growth Rate (CAGR)
10.2.3.5.Regional Bifurcation
10.2.3.5.1.North America
10.2.3.5.1.1.Market Estimation, 2016 – 2023
10.2.3.5.1.2.Market Forecast, 2024 – 2034
10.2.3.5.2.Europe
10.2.3.5.2.1.Market Estimation, 2016 – 2023
10.2.3.5.2.2.Market Forecast, 2024 – 2034
10.2.3.5.3.Asia Pacific
10.2.3.5.3.1.Market Estimation, 2016 – 2023
10.2.3.5.3.2.Market Forecast, 2024 – 2034
10.2.3.5.4.Middle East and Africa
10.2.3.5.4.1.Market Estimation, 2016 – 2023
10.2.3.5.4.2.Market Forecast, 2024 – 2034
10.2.3.5.5.Latin America
10.2.3.5.5.1.Market Estimation, 2016 – 2023
10.2.3.5.5.2.Market Forecast, 2024 – 2034
10.2.4.Real Estate
10.2.4.1.Definition
10.2.4.2.Market Estimation and Penetration, 2016 – 2023
10.2.4.3.Market Forecast, 2024 – 2034
10.2.4.4.Compound Annual Growth Rate (CAGR)
10.2.4.5.Regional Bifurcation
10.2.4.5.1.North America
10.2.4.5.1.1.Market Estimation, 2016 – 2023
10.2.4.5.1.2.Market Forecast, 2024 – 2034
10.2.4.5.2.Europe
10.2.4.5.2.1.Market Estimation, 2016 – 2023
10.2.4.5.2.2.Market Forecast, 2024 – 2034
10.2.4.5.3.Asia Pacific
10.2.4.5.3.1.Market Estimation, 2016 – 2023
10.2.4.5.3.2.Market Forecast, 2024 – 2034
10.2.4.5.4.Middle East and Africa
10.2.4.5.4.1.Market Estimation, 2016 – 2023
10.2.4.5.4.2.Market Forecast, 2024 – 2034
10.2.4.5.5.Latin America
10.2.4.5.5.1.Market Estimation, 2016 – 2023
10.2.4.5.5.2.Market Forecast, 2024 – 2034
10.2.5.Education
10.2.5.1.Definition
10.2.5.2.Market Estimation and Penetration, 2016 – 2023
10.2.5.3.Market Forecast, 2024 – 2034
10.2.5.4.Compound Annual Growth Rate (CAGR)
10.2.5.5.Regional Bifurcation
10.2.5.5.1.North America
10.2.5.5.1.1.Market Estimation, 2016 – 2023
10.2.5.5.1.2.Market Forecast, 2024 – 2034
10.2.5.5.2.Europe
10.2.5.5.2.1.Market Estimation, 2016 – 2023
10.2.5.5.2.2.Market Forecast, 2024 – 2034
10.2.5.5.3.Asia Pacific
10.2.5.5.3.1.Market Estimation, 2016 – 2023
10.2.5.5.3.2.Market Forecast, 2024 – 2034
10.2.5.5.4.Middle East and Africa
10.2.5.5.4.1.Market Estimation, 2016 – 2023
10.2.5.5.4.2.Market Forecast, 2024 – 2034
10.2.5.5.5.Latin America
10.2.5.5.5.1.Market Estimation, 2016 – 2023
10.2.5.5.5.2.Market Forecast, 2024 – 2034
10.2.6.Healthcare
10.2.6.1.Definition
10.2.6.2.Market Estimation and Penetration, 2016 – 2023
10.2.6.3.Market Forecast, 2024 – 2034
10.2.6.4.Compound Annual Growth Rate (CAGR)
10.2.6.5.Regional Bifurcation
10.2.6.5.1.North America
10.2.6.5.1.1.Market Estimation, 2016 – 2023
10.2.6.5.1.2.Market Forecast, 2024 – 2034
10.2.6.5.2.Europe
10.2.6.5.2.1.Market Estimation, 2016 – 2023
10.2.6.5.2.2.Market Forecast, 2024 – 2034
10.2.6.5.3.Asia Pacific
10.2.6.5.3.1.Market Estimation, 2016 – 2023
10.2.6.5.3.2.Market Forecast, 2024 – 2034
10.2.6.5.4.Middle East and Africa
10.2.6.5.4.1.Market Estimation, 2016 – 2023
10.2.6.5.4.2.Market Forecast, 2024 – 2034
10.2.6.5.5.Latin America
10.2.6.5.5.1.Market Estimation, 2016 – 2023
10.2.6.5.5.2.Market Forecast, 2024 – 2034
10.2.7.Automotive
10.2.7.1.Definition
10.2.7.2.Market Estimation and Penetration, 2016 – 2023
10.2.7.3.Market Forecast, 2024 – 2034
10.2.7.4.Compound Annual Growth Rate (CAGR)
10.2.7.5.Regional Bifurcation
10.2.7.5.1.North America
10.2.7.5.1.1.Market Estimation, 2016 – 2023
10.2.7.5.1.2.Market Forecast, 2024 – 2034
10.2.7.5.2.Europe
10.2.7.5.2.1.Market Estimation, 2016 – 2023
10.2.7.5.2.2.Market Forecast, 2024 – 2034
10.2.7.5.3.Asia Pacific
10.2.7.5.3.1.Market Estimation, 2016 – 2023
10.2.7.5.3.2.Market Forecast, 2024 – 2034
10.2.7.5.4.Middle East and Africa
10.2.7.5.4.1.Market Estimation, 2016 – 2023
10.2.7.5.4.2.Market Forecast, 2024 – 2034
10.2.7.5.5.Latin America
10.2.7.5.5.1.Market Estimation, 2016 – 2023
10.2.7.5.5.2.Market Forecast, 2024 – 2034
10.2.8.BSFI
10.2.8.1.Definition
10.2.8.2.Market Estimation and Penetration, 2016 – 2023
10.2.8.3.Market Forecast, 2024 – 2034
10.2.8.4.Compound Annual Growth Rate (CAGR)
10.2.8.5.Regional Bifurcation
10.2.8.5.1.North America
10.2.8.5.1.1.Market Estimation, 2016 – 2023
10.2.8.5.1.2.Market Forecast, 2024 – 2034
10.2.8.5.2.Europe
10.2.8.5.2.1.Market Estimation, 2016 – 2023
10.2.8.5.2.2.Market Forecast, 2024 – 2034
10.2.8.5.3.Asia Pacific
10.2.8.5.3.1.Market Estimation, 2016 – 2023
10.2.8.5.3.2.Market Forecast, 2024 – 2034
10.2.8.5.4.Middle East and Africa
10.2.8.5.4.1.Market Estimation, 2016 – 2023
10.2.8.5.4.2.Market Forecast, 2024 – 2034
10.2.8.5.5.Latin America
10.2.8.5.5.1.Market Estimation, 2016 – 2023
10.2.8.5.5.2.Market Forecast, 2024 – 2034
10.2.9.Retail and Consumer Goods
10.2.9.1.Definition
10.2.9.2.Market Estimation and Penetration, 2016 – 2023
10.2.9.3.Market Forecast, 2024 – 2034
10.2.9.4.Compound Annual Growth Rate (CAGR)
10.2.9.5.Regional Bifurcation
10.2.9.5.1.North America
10.2.9.5.1.1.Market Estimation, 2016 – 2023
10.2.9.5.1.2.Market Forecast, 2024 – 2034
10.2.9.5.2.Europe
10.2.9.5.2.1.Market Estimation, 2016 – 2023
10.2.9.5.2.2.Market Forecast, 2024 – 2034
10.2.9.5.3.Asia Pacific
10.2.9.5.3.1.Market Estimation, 2016 – 2023
10.2.9.5.3.2.Market Forecast, 2024 – 2034
10.2.9.5.4.Middle East and Africa
10.2.9.5.4.1.Market Estimation, 2016 – 2023
10.2.9.5.4.2.Market Forecast, 2024 – 2034
10.2.9.5.5.Latin America
10.2.9.5.5.1.Market Estimation, 2016 – 2023
10.2.9.5.5.2.Market Forecast, 2024 – 2034
10.2.10.IT and Technology
10.2.10.1.Definition
10.2.10.2.Market Estimation and Penetration, 2016 – 2023
10.2.10.3.Market Forecast, 2024 – 2034
10.2.10.4.Compound Annual Growth Rate (CAGR)
10.2.10.5.Regional Bifurcation
10.2.10.5.1.North America
10.2.10.5.1.1.Market Estimation, 2016 – 2023
10.2.10.5.1.2.Market Forecast, 2024 – 2034
10.2.10.5.2.Europe
10.2.10.5.2.1.Market Estimation, 2016 – 2023
10.2.10.5.2.2.Market Forecast, 2024 – 2034
10.2.10.5.3.Asia Pacific
10.2.10.5.3.1.Market Estimation, 2016 – 2023
10.2.10.5.3.2.Market Forecast, 2024 – 2034
10.2.10.5.4.Middle East and Africa
10.2.10.5.4.1.Market Estimation, 2016 – 2023
10.2.10.5.4.2.Market Forecast, 2024 – 2034
10.2.10.5.5.Latin America
10.2.10.5.5.1.Market Estimation, 2016 – 2023
10.2.10.5.5.2.Market Forecast, 2024 – 2034
10.2.11.Others
10.2.11.1.Definition
10.2.11.2.Market Estimation and Penetration, 2016 – 2023
10.2.11.3.Market Forecast, 2024 – 2034
10.2.11.4.Compound Annual Growth Rate (CAGR)
10.2.11.5.Regional Bifurcation
10.2.11.5.1.North America
10.2.11.5.1.1.Market Estimation, 2016 – 2023
10.2.11.5.1.2.Market Forecast, 2024 – 2034
10.2.11.5.2.Europe
10.2.11.5.2.1.Market Estimation, 2016 – 2023
10.2.11.5.2.2.Market Forecast, 2024 – 2034
10.2.11.5.3.Asia Pacific
10.2.11.5.3.1.Market Estimation, 2016 – 2023
10.2.11.5.3.2.Market Forecast, 2024 – 2034
10.2.11.5.4.Middle East and Africa
10.2.11.5.4.1.Market Estimation, 2016 – 2023
10.2.11.5.4.2.Market Forecast, 2024 – 2034
10.2.11.5.5.Latin America
10.2.11.5.5.1.Market Estimation, 2016 – 2023
10.2.11.5.5.2.Market Forecast, 2024 – 2034
10.3.Key Segment for Channeling Investments
10.3.1.By Industry Verticals
11.North America Advertising Market Analysis and Forecasts, 2024 – 2034
11.1.Overview
11.1.1.North America Advertising Market Revenue (US$ Mn)
11.2.North America Advertising Market Revenue (US$ Mn) and Forecasts, By Platform
11.2.1.Traditional Media
11.2.1.1.Television
11.2.1.2.Radio
11.2.1.3.Print
11.2.1.3.1.Newspapers
11.2.1.3.2.Magazines
11.2.1.3.3.Others
11.2.1.4.Billboards
11.2.2.Digital Media
11.2.2.1.Online Display Ads
11.2.2.2.Social Media Ads
11.2.2.3.Search Engine Marketing (SEM)
11.2.2.3.1.Pay-per-click (PPC)
11.2.2.3.2.Display ads
11.2.2.3.3.Product Listing ads (PLAs)
11.2.2.4.Email Marketing
11.2.2.5.Programmatic Advertising
11.2.2.6.Over-the-Top (OTT) Advertising
11.2.2.7.Native ads
11.2.2.8.Interactive ads
11.2.2.9.Others
11.3.North America Advertising Market Revenue (US$ Mn) and Forecasts, By Add Format
11.3.1.Text
11.3.2.Image
11.3.3.Video
11.3.4.Banners
11.3.5.Others
11.4.North America Advertising Market Revenue (US$ Mn) and Forecasts, By Industry Verticals
11.4.1.Food and Beverage
11.4.2.Travel and Hospitality
11.4.3.Entertainment and Media
11.4.4.Real Estate
11.4.5.Education
11.4.6.Healthcare
11.4.7.Automotive
11.4.8.BSFI
11.4.9.Retail and Consumer Goods
11.4.10.IT and Technology
11.4.11.Others
11.5.North America Advertising Market Revenue (US$ Mn) and Forecasts, By Country
11.5.1.U.S
11.5.1.1.U.S Advertising Market Revenue (US$ Mn) and Forecasts, By Platform
11.5.1.1.1.Traditional Media
11.5.1.1.1.1.Television
11.5.1.1.1.2.Radio
11.5.1.1.1.3.Print
11.5.1.1.1.3.1.Newspapers
11.5.1.1.1.3.2.Magazines
11.5.1.1.1.3.3.Others
11.5.1.1.1.4.Billboards
11.5.1.1.2.Digital Media
11.5.1.1.2.1.Online Display Ads
11.5.1.1.2.2.Social Media Ads
11.5.1.1.2.3.Search Engine Marketing (SEM)
11.5.1.1.2.3.1.Pay-per-click (PPC)
11.5.1.1.2.3.2.Display ads
11.5.1.1.2.3.3.Product Listing ads (PLAs)
11.5.1.1.2.4.Email Marketing
11.5.1.1.2.5.Programmatic Advertising
11.5.1.1.2.6.Over-the-Top (OTT) Advertising
11.5.1.1.2.7.Native ads
11.5.1.1.2.8.Interactive ads
11.5.1.1.2.9.Others
11.5.1.2.U.S Advertising Market Revenue (US$ Mn) and Forecasts, By Add Format
11.5.1.2.1.Text
11.5.1.2.2.Image
11.5.1.2.3.Video
11.5.1.2.4.Banners
11.5.1.2.5.Others
11.5.1.3.U.S Advertising Market Revenue (US$ Mn) and Forecasts, By Industry Verticals
11.5.1.3.1.Food and Beverage
11.5.1.3.2.Travel and Hospitality
11.5.1.3.3.Entertainment and Media
11.5.1.3.4.Real Estate
11.5.1.3.5.Education
11.5.1.3.6.Healthcare
11.5.1.3.7.Automotive
11.5.1.3.8.BSFI
11.5.1.3.9.Retail and Consumer Goods
11.5.1.3.10.IT and Technology
11.5.1.3.11.Others
11.5.2.Canada
11.5.2.1.Canada Advertising Market Revenue (US$ Mn) and Forecasts, By Platform
11.5.2.1.1.Traditional Media
11.5.2.1.1.1.Television
11.5.2.1.1.2.Radio
11.5.2.1.1.3.Print
11.5.2.1.1.3.1.Newspapers
11.5.2.1.1.3.2.Magazines
11.5.2.1.1.3.3.Others
11.5.2.1.1.4.Billboards
11.5.2.1.2.Digital Media
11.5.2.1.2.1.Online Display Ads
11.5.2.1.2.2.Social Media Ads
11.5.2.1.2.3.Search Engine Marketing (SEM)
11.5.2.1.2.3.1.Pay-per-click (PPC)
11.5.2.1.2.3.2.Display ads
11.5.2.1.2.3.3.Product Listing ads (PLAs)
11.5.2.1.2.4.Email Marketing
11.5.2.1.2.5.Programmatic Advertising
11.5.2.1.2.6.Over-the-Top (OTT) Advertising
11.5.2.1.2.7.Native ads
11.5.2.1.2.8.Interactive ads
11.5.2.1.2.9.Others
11.5.2.2.Canada Advertising Market Revenue (US$ Mn) and Forecasts, By Add Format
11.5.2.2.1.Text
11.5.2.2.2.Image
11.5.2.2.3.Video
11.5.2.2.4.Banners
11.5.2.2.5.Others
11.5.2.3.Canada Advertising Market Revenue (US$ Mn) and Forecasts, By Industry Verticals
11.5.2.3.1.Food and Beverage
11.5.2.3.2.Travel and Hospitality
11.5.2.3.3.Entertainment and Media
11.5.2.3.4.Real Estate
11.5.2.3.5.Education
11.5.2.3.6.Healthcare
11.5.2.3.7.Automotive
11.5.2.3.8.BSFI
11.5.2.3.9.Retail and Consumer Goods
11.5.2.3.10.IT and Technology
11.5.2.3.11.Others
11.5.3.Mexico
11.5.3.1.Mexico Advertising Market Revenue (US$ Mn) and Forecasts, By Platform
11.5.3.1.1.Traditional Media
11.5.3.1.1.1.Television
11.5.3.1.1.2.Radio
11.5.3.1.1.3.Print
11.5.3.1.1.3.1.Newspapers
11.5.3.1.1.3.2.Magazines
11.5.3.1.1.3.3.Others
11.5.3.1.1.4.Billboards
11.5.3.1.2.Digital Media
11.5.3.1.2.1.Online Display Ads
11.5.3.1.2.2.Social Media Ads
11.5.3.1.2.3.Search Engine Marketing (SEM)
11.5.3.1.2.3.1.Pay-per-click (PPC)
11.5.3.1.2.3.2.Display ads
11.5.3.1.2.3.3.Product Listing ads (PLAs)
11.5.3.1.2.4.Email Marketing
11.5.3.1.2.5.Programmatic Advertising
11.5.3.1.2.6.Over-the-Top (OTT) Advertising
11.5.3.1.2.7.Native ads
11.5.3.1.2.8.Interactive ads
11.5.3.1.2.9.Others
11.5.3.2.Mexico Advertising Market Revenue (US$ Mn) and Forecasts, By Add Format
11.5.3.2.1.Text
11.5.3.2.2.Image
11.5.3.2.3.Video
11.5.3.2.4.Banners
11.5.3.2.5.Others
11.5.3.3.Mexico Advertising Market Revenue (US$ Mn) and Forecasts, By Industry Verticals
11.5.3.3.1.Food and Beverage
11.5.3.3.2.Travel and Hospitality
11.5.3.3.3.Entertainment and Media
11.5.3.3.4.Real Estate
11.5.3.3.5.Education
11.5.3.3.6.Healthcare
11.5.3.3.7.Automotive
11.5.3.3.8.BSFI
11.5.3.3.9.Retail and Consumer Goods
11.5.3.3.10.IT and Technology
11.5.3.3.11.Others
11.5.4.Rest of North America
11.5.4.1.Rest of North America Advertising Market Revenue (US$ Mn) and Forecasts, By Platform
11.5.4.1.1.Traditional Media
11.5.4.1.1.1.Television
11.5.4.1.1.2.Radio
11.5.4.1.1.3.Print
11.5.4.1.1.3.1.Newspapers
11.5.4.1.1.3.2.Magazines
11.5.4.1.1.3.3.Others
11.5.4.1.1.4.Billboards
11.5.4.1.2.Digital Media
11.5.4.1.2.1.Online Display Ads
11.5.4.1.2.2.Social Media Ads
11.5.4.1.2.3.Search Engine Marketing (SEM)
11.5.4.1.2.3.1.Pay-per-click (PPC)
11.5.4.1.2.3.2.Display ads
11.5.4.1.2.3.3.Product Listing ads (PLAs)
11.5.4.1.2.4.Email Marketing
11.5.4.1.2.5.Programmatic Advertising
11.5.4.1.2.6.Over-the-Top (OTT) Advertising
11.5.4.1.2.7.Native ads
11.5.4.1.2.8.Interactive ads
11.5.4.1.2.9.Others
11.5.4.2.Rest of North America Advertising Market Revenue (US$ Mn) and Forecasts, By Add Format
11.5.4.2.1.Text
11.5.4.2.2.Image
11.5.4.2.3.Video
11.5.4.2.4.Banners
11.5.4.2.5.Others
11.5.4.3.Rest of North America Advertising Market Revenue (US$ Mn) and Forecasts, By Industry Verticals
11.5.4.3.1.Food and Beverage
11.5.4.3.2.Travel and Hospitality
11.5.4.3.3.Entertainment and Media
11.5.4.3.4.Real Estate
11.5.4.3.5.Education
11.5.4.3.6.Healthcare
11.5.4.3.7.Automotive
11.5.4.3.8.BSFI
11.5.4.3.9.Retail and Consumer Goods
11.5.4.3.10.IT and Technology
11.5.4.3.11.Others
11.6.Key Segment for Channeling Investments
11.6.1.By Country
11.6.2.By Platform
11.6.3.By Add Format
11.6.4.By Industry Verticals
12.Europe Advertising Market Analysis and Forecasts, 2024 – 2034
12.1.Overview
12.1.1.Europe Advertising Market Revenue (US$ Mn)
12.2.Europe Advertising Market Revenue (US$ Mn) and Forecasts, By Platform
12.2.1.Traditional Media
12.2.1.1.Television
12.2.1.2.Radio
12.2.1.3.Print
12.2.1.3.1.Newspapers
12.2.1.3.2.Magazines
12.2.1.3.3.Others
12.2.1.4.Billboards
12.2.2.Digital Media
12.2.2.1.Online Display Ads
12.2.2.2.Social Media Ads
12.2.2.3.Search Engine Marketing (SEM)
12.2.2.3.1.Pay-per-click (PPC)
12.2.2.3.2.Display ads
12.2.2.3.3.Product Listing ads (PLAs)
12.2.2.4.Email Marketing
12.2.2.5.Programmatic Advertising
12.2.2.6.Over-the-Top (OTT) Advertising
12.2.2.7.Native ads
12.2.2.8.Interactive ads
12.2.2.9.Others
12.3.Europe Advertising Market Revenue (US$ Mn) and Forecasts, By Add Format
12.3.1.Text
12.3.2.Image
12.3.3.Video
12.3.4.Banners
12.3.5.Others
12.4.Europe Advertising Market Revenue (US$ Mn) and Forecasts, By Industry Verticals
12.4.1.Food and Beverage
12.4.2.Travel and Hospitality
12.4.3.Entertainment and Media
12.4.4.Real Estate
12.4.5.Education
12.4.6.Healthcare
12.4.7.Automotive
12.4.8.BSFI
12.4.9.Retail and Consumer Goods
12.4.10.IT and Technology
12.4.11.Others
12.5.Europe Advertising Market Revenue (US$ Mn) and Forecasts, By Country
12.5.1.France
12.5.1.1.France Advertising Market Revenue (US$ Mn) and Forecasts, By Platform
12.5.1.1.1.Traditional Media
12.5.1.1.1.1.Television
12.5.1.1.1.2.Radio
12.5.1.1.1.3.Print
12.5.1.1.1.3.1.Newspapers
12.5.1.1.1.3.2.Magazines
12.5.1.1.1.3.3.Others
12.5.1.1.1.4.Billboards
12.5.1.1.2.Digital Media
12.5.1.1.2.1.Online Display Ads
12.5.1.1.2.2.Social Media Ads
12.5.1.1.2.3.Search Engine Marketing (SEM)
12.5.1.1.2.3.1.Pay-per-click (PPC)
12.5.1.1.2.3.2.Display ads
12.5.1.1.2.3.3.Product Listing ads (PLAs)
12.5.1.1.2.4.Email Marketing
12.5.1.1.2.5.Programmatic Advertising
12.5.1.1.2.6.Over-the-Top (OTT) Advertising
12.5.1.1.2.7.Native ads
12.5.1.1.2.8.Interactive ads
12.5.1.1.2.9.Others
12.5.1.2.France Advertising Market Revenue (US$ Mn) and Forecasts, By Add Format
12.5.1.2.1.Text
12.5.1.2.2.Image
12.5.1.2.3.Video
12.5.1.2.4.Banners
12.5.1.2.5.Others
12.5.1.3.France Advertising Market Revenue (US$ Mn) and Forecasts, By Industry Verticals
12.5.1.3.1.Food and Beverage
12.5.1.3.2.Travel and Hospitality
12.5.1.3.3.Entertainment and Media
12.5.1.3.4.Real Estate
12.5.1.3.5.Education
12.5.1.3.6.Healthcare
12.5.1.3.7.Automotive
12.5.1.3.8.BSFI
12.5.1.3.9.Retail and Consumer Goods
12.5.1.3.10.IT and Technology
12.5.1.3.11.Others
12.5.2.The UK
12.5.2.1.The UK Advertising Market Revenue (US$ Mn) and Forecasts, By Platform
12.5.2.1.1.Traditional Media
12.5.2.1.1.1.Television
12.5.2.1.1.2.Radio
12.5.2.1.1.3.Print
12.5.2.1.1.3.1.Newspapers
12.5.2.1.1.3.2.Magazines
12.5.2.1.1.3.3.Others
12.5.2.1.1.4.Billboards
12.5.2.1.2.Digital Media
12.5.2.1.2.1.Online Display Ads
12.5.2.1.2.2.Social Media Ads
12.5.2.1.2.3.Search Engine Marketing (SEM)
12.5.2.1.2.3.1.Pay-per-click (PPC)
12.5.2.1.2.3.2.Display ads
12.5.2.1.2.3.3.Product Listing ads (PLAs)
12.5.2.1.2.4.Email Marketing
12.5.2.1.2.5.Programmatic Advertising
12.5.2.1.2.6.Over-the-Top (OTT) Advertising
12.5.2.1.2.7.Native ads
12.5.2.1.2.8.Interactive ads
12.5.2.1.2.9.Others
12.5.2.2.The UK Advertising Market Revenue (US$ Mn) and Forecasts, By Add Format
12.5.2.2.1.Text
12.5.2.2.2.Image
12.5.2.2.3.Video
12.5.2.2.4.Banners
12.5.2.2.5.Others
12.5.2.3.The UK Advertising Market Revenue (US$ Mn) and Forecasts, By Industry Verticals
12.5.2.3.1.Food and Beverage
12.5.2.3.2.Travel and Hospitality
12.5.2.3.3.Entertainment and Media
12.5.2.3.4.Real Estate
12.5.2.3.5.Education
12.5.2.3.6.Healthcare
12.5.2.3.7.Automotive
12.5.2.3.8.BSFI
12.5.2.3.9.Retail and Consumer Goods
12.5.2.3.10.IT and Technology
12.5.2.3.11.Others
12.5.3.Spain
12.5.3.1.Spain Advertising Market Revenue (US$ Mn) and Forecasts, By Platform
12.5.3.1.1.Traditional Media
12.5.3.1.1.1.Television
12.5.3.1.1.2.Radio
12.5.3.1.1.3.Print
12.5.3.1.1.3.1.Newspapers
12.5.3.1.1.3.2.Magazines
12.5.3.1.1.3.3.Others
12.5.3.1.1.4.Billboards
12.5.3.1.2.Digital Media
12.5.3.1.2.1.Online Display Ads
12.5.3.1.2.2.Social Media Ads
12.5.3.1.2.3.Search Engine Marketing (SEM)
12.5.3.1.2.3.1.Pay-per-click (PPC)
12.5.3.1.2.3.2.Display ads
12.5.3.1.2.3.3.Product Listing ads (PLAs)
12.5.3.1.2.4.Email Marketing
12.5.3.1.2.5.Programmatic Advertising
12.5.3.1.2.6.Over-the-Top (OTT) Advertising
12.5.3.1.2.7.Native ads
12.5.3.1.2.8.Interactive ads
12.5.3.1.2.9.Others
12.5.3.2.Spain Advertising Market Revenue (US$ Mn) and Forecasts, By Add Format
12.5.3.2.1.Text
12.5.3.2.2.Image
12.5.3.2.3.Video
12.5.3.2.4.Banners
12.5.3.2.5.Others
12.5.3.3.Spain Advertising Market Revenue (US$ Mn) and Forecasts, By Industry Verticals
12.5.3.3.1.Food and Beverage
12.5.3.3.2.Travel and Hospitality
12.5.3.3.3.Entertainment and Media
12.5.3.3.4.Real Estate
12.5.3.3.5.Education
12.5.3.3.6.Healthcare
12.5.3.3.7.Automotive
12.5.3.3.8.BSFI
12.5.3.3.9.Retail and Consumer Goods
12.5.3.3.10.IT and Technology
12.5.3.3.11.Others
12.5.4.Germany
12.5.4.1.Germany Advertising Market Revenue (US$ Mn) and Forecasts, By Platform
12.5.4.1.1.Traditional Media
12.5.4.1.1.1.Television
12.5.4.1.1.2.Radio
12.5.4.1.1.3.Print
12.5.4.1.1.3.1.Newspapers
12.5.4.1.1.3.2.Magazines
12.5.4.1.1.3.3.Others
12.5.4.1.1.4.Billboards
12.5.4.1.2.Digital Media
12.5.4.1.2.1.Online Display Ads
12.5.4.1.2.2.Social Media Ads
12.5.4.1.2.3.Search Engine Marketing (SEM)
12.5.4.1.2.3.1.Pay-per-click (PPC)
12.5.4.1.2.3.2.Display ads
12.5.4.1.2.3.3.Product Listing ads (PLAs)
12.5.4.1.2.4.Email Marketing
12.5.4.1.2.5.Programmatic Advertising
12.5.4.1.2.6.Over-the-Top (OTT) Advertising
12.5.4.1.2.7.Native ads
12.5.4.1.2.8.Interactive ads
12.5.4.1.2.9.Others
12.5.4.2.Germany Advertising Market Revenue (US$ Mn) and Forecasts, By Add Format
12.5.4.2.1.Text
12.5.4.2.2.Image
12.5.4.2.3.Video
12.5.4.2.4.Banners
12.5.4.2.5.Others
12.5.4.3.Germany Advertising Market Revenue (US$ Mn) and Forecasts, By Industry Verticals
12.5.4.3.1.Food and Beverage
12.5.4.3.2.Travel and Hospitality
12.5.4.3.3.Entertainment and Media
12.5.4.3.4.Real Estate
12.5.4.3.5.Education
12.5.4.3.6.Healthcare
12.5.4.3.7.Automotive
12.5.4.3.8.BSFI
12.5.4.3.9.Retail and Consumer Goods
12.5.4.3.10.IT and Technology
12.5.4.3.11.Others
12.5.5.Italy
12.5.5.1.Italy Advertising Market Revenue (US$ Mn) and Forecasts, By Platform
12.5.5.1.1.Traditional Media
12.5.5.1.1.1.Television
12.5.5.1.1.2.Radio
12.5.5.1.1.3.Print
12.5.5.1.1.3.1.Newspapers
12.5.5.1.1.3.2.Magazines
12.5.5.1.1.3.3.Others
12.5.5.1.1.4.Billboards
12.5.5.1.2.Digital Media
12.5.5.1.2.1.Online Display Ads
12.5.5.1.2.2.Social Media Ads
12.5.5.1.2.3.Search Engine Marketing (SEM)
12.5.5.1.2.3.1.Pay-per-click (PPC)
12.5.5.1.2.3.2.Display ads
12.5.5.1.2.3.3.Product Listing ads (PLAs)
12.5.5.1.2.4.Email Marketing
12.5.5.1.2.5.Programmatic Advertising
12.5.5.1.2.6.Over-the-Top (OTT) Advertising
12.5.5.1.2.7.Native ads
12.5.5.1.2.8.Interactive ads
12.5.5.1.2.9.Others
12.5.5.2.Italy Advertising Market Revenue (US$ Mn) and Forecasts, By Add Format
12.5.5.2.1.Text
12.5.5.2.2.Image
12.5.5.2.3.Video
12.5.5.2.4.Banners
12.5.5.2.5.Others
12.5.5.3.Italy Advertising Market Revenue (US$ Mn) and Forecasts, By Industry Verticals
12.5.5.3.1.Food and Beverage
12.5.5.3.2.Travel and Hospitality
12.5.5.3.3.Entertainment and Media
12.5.5.3.4.Real Estate
12.5.5.3.5.Education
12.5.5.3.6.Healthcare
12.5.5.3.7.Automotive
12.5.5.3.8.BSFI
12.5.5.3.9.Retail and Consumer Goods
12.5.5.3.10.IT and Technology
12.5.5.3.11.Others
12.5.6.Nordic Countries
12.5.6.1.Nordic Countries Advertising Market Revenue (US$ Mn) and Forecasts, By Platform
12.5.6.1.1.Traditional Media
12.5.6.1.1.1.Television
12.5.6.1.1.2.Radio
12.5.6.1.1.3.Print
12.5.6.1.1.3.1.Newspapers
12.5.6.1.1.3.2.Magazines
12.5.6.1.1.3.3.Others
12.5.6.1.1.4.Billboards
12.5.6.1.2.Digital Media
12.5.6.1.2.1.Online Display Ads
12.5.6.1.2.2.Social Media Ads
12.5.6.1.2.3.Search Engine Marketing (SEM)
12.5.6.1.2.3.1.Pay-per-click (PPC)
12.5.6.1.2.3.2.Display ads
12.5.6.1.2.3.3.Product Listing ads (PLAs)
12.5.6.1.2.4.Email Marketing
12.5.6.1.2.5.Programmatic Advertising
12.5.6.1.2.6.Over-the-Top (OTT) Advertising
12.5.6.1.2.7.Native ads
12.5.6.1.2.8.Interactive ads
12.5.6.1.2.9.Others
12.5.6.2.Nordic Countries Advertising Market Revenue (US$ Mn) and Forecasts, By Add Format
12.5.6.2.1.Text
12.5.6.2.2.Image
12.5.6.2.3.Video
12.5.6.2.4.Banners
12.5.6.2.5.Others
12.5.6.3.Nordic Countries Advertising Market Revenue (US$ Mn) and Forecasts, By Industry Verticals
12.5.6.3.1.Food and Beverage
12.5.6.3.2.Travel and Hospitality
12.5.6.3.3.Entertainment and Media
12.5.6.3.4.Real Estate
12.5.6.3.5.Education
12.5.6.3.6.Healthcare
12.5.6.3.7.Automotive
12.5.6.3.8.BSFI
12.5.6.3.9.Retail and Consumer Goods
12.5.6.3.10.IT and Technology
12.5.6.3.11.Others
12.5.6.4.Nordic Countries Advertising Market Revenue (US$ Mn) and Forecasts, By Country
12.5.6.4.1.Denmark
12.5.6.4.2.Finland
12.5.6.4.3.Iceland
12.5.6.4.4.Sweden
12.5.6.4.5.Norway
12.5.7.Benelux Union
12.5.7.1.Benelux Union Advertising Market Revenue (US$ Mn) and Forecasts, By Platform
12.5.7.1.1.Traditional Media
12.5.7.1.1.1.Television
12.5.7.1.1.2.Radio
12.5.7.1.1.3.Print
12.5.7.1.1.3.1.Newspapers
12.5.7.1.1.3.2.Magazines
12.5.7.1.1.3.3.Others
12.5.7.1.1.4.Billboards
12.5.7.1.2.Digital Media
12.5.7.1.2.1.Online Display Ads
12.5.7.1.2.2.Social Media Ads
12.5.7.1.2.3.Search Engine Marketing (SEM)
12.5.7.1.2.3.1.Pay-per-click (PPC)
12.5.7.1.2.3.2.Display ads
12.5.7.1.2.3.3.Product Listing ads (PLAs)
12.5.7.1.2.4.Email Marketing
12.5.7.1.2.5.Programmatic Advertising
12.5.7.1.2.6.Over-the-Top (OTT) Advertising
12.5.7.1.2.7.Native ads
12.5.7.1.2.8.Interactive ads
12.5.7.1.2.9.Others
12.5.7.2.Benelux Union Advertising Market Revenue (US$ Mn) and Forecasts, By Add Format
12.5.7.2.1.Text
12.5.7.2.2.Image
12.5.7.2.3.Video
12.5.7.2.4.Banners
12.5.7.2.5.Others
12.5.7.3.Benelux Union Advertising Market Revenue (US$ Mn) and Forecasts, By Industry Verticals
12.5.7.3.1.Food and Beverage
12.5.7.3.2.Travel and Hospitality
12.5.7.3.3.Entertainment and Media
12.5.7.3.4.Real Estate
12.5.7.3.5.Education
12.5.7.3.6.Healthcare
12.5.7.3.7.Automotive
12.5.7.3.8.BSFI
12.5.7.3.9.Retail and Consumer Goods
12.5.7.3.10.IT and Technology
12.5.7.3.11.Others
12.5.7.4.Benelux Union Advertising Market Revenue (US$ Mn) and Forecasts, By Country
12.5.7.4.1.Belgium
12.5.7.4.2.The Netherlands
12.5.7.4.3.Luxembourg
12.5.8.Rest of Europe
12.5.8.1.Rest of Europe Advertising Market Revenue (US$ Mn) and Forecasts, By Platform
12.5.8.1.1.Traditional Media
12.5.8.1.1.1.Television
12.5.8.1.1.2.Radio
12.5.8.1.1.3.Print
12.5.8.1.1.3.1.Newspapers
12.5.8.1.1.3.2.Magazines
12.5.8.1.1.3.3.Others
12.5.8.1.1.4.Billboards
12.5.8.1.2.Digital Media
12.5.8.1.2.1.Online Display Ads
12.5.8.1.2.2.Social Media Ads
12.5.8.1.2.3.Search Engine Marketing (SEM)
12.5.8.1.2.3.1.Pay-per-click (PPC)
12.5.8.1.2.3.2.Display ads
12.5.8.1.2.3.3.Product Listing ads (PLAs)
12.5.8.1.2.4.Email Marketing
12.5.8.1.2.5.Programmatic Advertising
12.5.8.1.2.6.Over-the-Top (OTT) Advertising
12.5.8.1.2.7.Native ads
12.5.8.1.2.8.Interactive ads
12.5.8.1.2.9.Others
12.5.8.2.Rest of Europe Advertising Market Revenue (US$ Mn) and Forecasts, By Add Format
12.5.8.2.1.Text
12.5.8.2.2.Image
12.5.8.2.3.Video
12.5.8.2.4.Banners
12.5.8.2.5.Others
12.5.8.3.Rest of Europe Advertising Market Revenue (US$ Mn) and Forecasts, By Industry Verticals
12.5.8.3.1.Food and Beverage
12.5.8.3.2.Travel and Hospitality
12.5.8.3.3.Entertainment and Media
12.5.8.3.4.Real Estate
12.5.8.3.5.Education
12.5.8.3.6.Healthcare
12.5.8.3.7.Automotive
12.5.8.3.8.BSFI
12.5.8.3.9.Retail and Consumer Goods
12.5.8.3.10.IT and Technology
12.5.8.3.11.Others
12.6.Key Segment for Channeling Investments
12.6.1.By Country
12.6.2.By Platform
12.6.3.By Add Format
12.6.4.By Industry Verticals
13.Asia Pacific Advertising Market Analysis and Forecasts, 2024 – 2034
13.1.Overview
13.1.1.Asia Pacific Advertising Market Revenue (US$ Mn)
13.2.Asia Pacific Advertising Market Revenue (US$ Mn) and Forecasts, By Platform
13.2.1.Traditional Media
13.2.1.1.Television
13.2.1.2.Radio
13.2.1.3.Print
13.2.1.3.1.Newspapers
13.2.1.3.2.Magazines
13.2.1.3.3.Others
13.2.1.4.Billboards
13.2.2.Digital Media
13.2.2.1.Online Display Ads
13.2.2.2.Social Media Ads
13.2.2.3.Search Engine Marketing (SEM)
13.2.2.3.1.Pay-per-click (PPC)
13.2.2.3.2.Display ads
13.2.2.3.3.Product Listing ads (PLAs)
13.2.2.4.Email Marketing
13.2.2.5.Programmatic Advertising
13.2.2.6.Over-the-Top (OTT) Advertising
13.2.2.7.Native ads
13.2.2.8.Interactive ads
13.2.2.9.Others
13.3.Asia Pacific Advertising Market Revenue (US$ Mn) and Forecasts, By Add Format
13.3.1.Text
13.3.2.Image
13.3.3.Video
13.3.4.Banners
13.3.5.Others
13.4.Asia Pacific Advertising Market Revenue (US$ Mn) and Forecasts, By Industry Verticals
13.4.1.Food and Beverage
13.4.2.Travel and Hospitality
13.4.3.Entertainment and Media
13.4.4.Real Estate
13.4.5.Education
13.4.6.Healthcare
13.4.7.Automotive
13.4.8.BSFI
13.4.9.Retail and Consumer Goods
13.4.10.IT and Technology
13.4.11.Others
13.5.Asia Pacific Advertising Market Revenue (US$ Mn) and Forecasts, By Country
13.5.1.China
13.5.1.1.China Advertising Market Revenue (US$ Mn) and Forecasts, By Platform
13.5.1.1.1.Traditional Media
13.5.1.1.1.1.Television
13.5.1.1.1.2.Radio
13.5.1.1.1.3.Print
13.5.1.1.1.3.1.Newspapers
13.5.1.1.1.3.2.Magazines
13.5.1.1.1.3.3.Others
13.5.1.1.1.4.Billboards
13.5.1.1.2.Digital Media
13.5.1.1.2.1.Online Display Ads
13.5.1.1.2.2.Social Media Ads
13.5.1.1.2.3.Search Engine Marketing (SEM)
13.5.1.1.2.3.1.Pay-per-click (PPC)
13.5.1.1.2.3.2.Display ads
13.5.1.1.2.3.3.Product Listing ads (PLAs)
13.5.1.1.2.4.Email Marketing
13.5.1.1.2.5.Programmatic Advertising
13.5.1.1.2.6.Over-the-Top (OTT) Advertising
13.5.1.1.2.7.Native ads
13.5.1.1.2.8.Interactive ads
13.5.1.1.2.9.Others
13.5.1.2.China Advertising Market Revenue (US$ Mn) and Forecasts, By Add Format
13.5.1.2.1.Text
13.5.1.2.2.Image
13.5.1.2.3.Video
13.5.1.2.4.Banners
13.5.1.2.5.Others
13.5.1.3.China Advertising Market Revenue (US$ Mn) and Forecasts, By Industry Verticals
13.5.1.3.1.Food and Beverage
13.5.1.3.2.Travel and Hospitality
13.5.1.3.3.Entertainment and Media
13.5.1.3.4.Real Estate
13.5.1.3.5.Education
13.5.1.3.6.Healthcare
13.5.1.3.7.Automotive
13.5.1.3.8.BSFI
13.5.1.3.9.Retail and Consumer Goods
13.5.1.3.10.IT and Technology
13.5.1.3.11.Others
13.5.2.Japan
13.5.2.1.Japan Advertising Market Revenue (US$ Mn) and Forecasts, By Platform
13.5.2.1.1.Traditional Media
13.5.2.1.1.1.Television
13.5.2.1.1.2.Radio
13.5.2.1.1.3.Print
13.5.2.1.1.3.1.Newspapers
13.5.2.1.1.3.2.Magazines
13.5.2.1.1.3.3.Others
13.5.2.1.1.4.Billboards
13.5.2.1.2.Digital Media
13.5.2.1.2.1.Online Display Ads
13.5.2.1.2.2.Social Media Ads
13.5.2.1.2.3.Search Engine Marketing (SEM)
13.5.2.1.2.3.1.Pay-per-click (PPC)
13.5.2.1.2.3.2.Display ads
13.5.2.1.2.3.3.Product Listing ads (PLAs)
13.5.2.1.2.4.Email Marketing
13.5.2.1.2.5.Programmatic Advertising
13.5.2.1.2.6.Over-the-Top (OTT) Advertising
13.5.2.1.2.7.Native ads
13.5.2.1.2.8.Interactive ads
13.5.2.1.2.9.Others
13.5.2.2.Japan Advertising Market Revenue (US$ Mn) and Forecasts, By Add Format
13.5.2.2.1.Text
13.5.2.2.2.Image
13.5.2.2.3.Video
13.5.2.2.4.Banners
13.5.2.2.5.Others
13.5.2.3.Japan Advertising Market Revenue (US$ Mn) and Forecasts, By Industry Verticals
13.5.2.3.1.Food and Beverage
13.5.2.3.2.Travel and Hospitality
13.5.2.3.3.Entertainment and Media
13.5.2.3.4.Real Estate
13.5.2.3.5.Education
13.5.2.3.6.Healthcare
13.5.2.3.7.Automotive
13.5.2.3.8.BSFI
13.5.2.3.9.Retail and Consumer Goods
13.5.2.3.10.IT and Technology
13.5.2.3.11.Others
13.5.3.India
13.5.3.1.India Advertising Market Revenue (US$ Mn) and Forecasts, By Platform
13.5.3.1.1.Traditional Media
13.5.3.1.1.1.Television
13.5.3.1.1.2.Radio
13.5.3.1.1.3.Print
13.5.3.1.1.3.1.Newspapers
13.5.3.1.1.3.2.Magazines
13.5.3.1.1.3.3.Others
13.5.3.1.1.4.Billboards
13.5.3.1.2.Digital Media
13.5.3.1.2.1.Online Display Ads
13.5.3.1.2.2.Social Media Ads
13.5.3.1.2.3.Search Engine Marketing (SEM)
13.5.3.1.2.3.1.Pay-per-click (PPC)
13.5.3.1.2.3.2.Display ads
13.5.3.1.2.3.3.Product Listing ads (PLAs)
13.5.3.1.2.4.Email Marketing
13.5.3.1.2.5.Programmatic Advertising
13.5.3.1.2.6.Over-the-Top (OTT) Advertising
13.5.3.1.2.7.Native ads
13.5.3.1.2.8.Interactive ads
13.5.3.1.2.9.Others
13.5.3.2.India Advertising Market Revenue (US$ Mn) and Forecasts, By Add Format
13.5.3.2.1.Text
13.5.3.2.2.Image
13.5.3.2.3.Video
13.5.3.2.4.Banners
13.5.3.2.5.Others
13.5.3.3.India Advertising Market Revenue (US$ Mn) and Forecasts, By Industry Verticals
13.5.3.3.1.Food and Beverage
13.5.3.3.2.Travel and Hospitality
13.5.3.3.3.Entertainment and Media
13.5.3.3.4.Real Estate
13.5.3.3.5.Education
13.5.3.3.6.Healthcare
13.5.3.3.7.Automotive
13.5.3.3.8.BSFI
13.5.3.3.9.Retail and Consumer Goods
13.5.3.3.10.IT and Technology
13.5.3.3.11.Others
13.5.4.New Zealand
13.5.4.1.New Zealand Advertising Market Revenue (US$ Mn) and Forecasts, By Platform
13.5.4.1.1.Traditional Media
13.5.4.1.1.1.Television
13.5.4.1.1.2.Radio
13.5.4.1.1.3.Print
13.5.4.1.1.3.1.Newspapers
13.5.4.1.1.3.2.Magazines
13.5.4.1.1.3.3.Others
13.5.4.1.1.4.Billboards
13.5.4.1.2.Digital Media
13.5.4.1.2.1.Online Display Ads
13.5.4.1.2.2.Social Media Ads
13.5.4.1.2.3.Search Engine Marketing (SEM)
13.5.4.1.2.3.1.Pay-per-click (PPC)
13.5.4.1.2.3.2.Display ads
13.5.4.1.2.3.3.Product Listing ads (PLAs)
13.5.4.1.2.4.Email Marketing
13.5.4.1.2.5.Programmatic Advertising
13.5.4.1.2.6.Over-the-Top (OTT) Advertising
13.5.4.1.2.7.Native ads
13.5.4.1.2.8.Interactive ads
13.5.4.1.2.9.Others
13.5.4.2.New Zealand Advertising Market Revenue (US$ Mn) and Forecasts, By Add Format
13.5.4.2.1.Text
13.5.4.2.2.Image
13.5.4.2.3.Video
13.5.4.2.4.Banners
13.5.4.2.5.Others
13.5.4.3.New Zealand Advertising Market Revenue (US$ Mn) and Forecasts, By Industry Verticals
13.5.4.3.1.Food and Beverage
13.5.4.3.2.Travel and Hospitality
13.5.4.3.3.Entertainment and Media
13.5.4.3.4.Real Estate
13.5.4.3.5.Education
13.5.4.3.6.Healthcare
13.5.4.3.7.Automotive
13.5.4.3.8.BSFI
13.5.4.3.9.Retail and Consumer Goods
13.5.4.3.10.IT and Technology
13.5.4.3.11.Others
13.5.5.Australia
13.5.5.1.Australia Advertising Market Revenue (US$ Mn) and Forecasts, By Platform
13.5.5.1.1.Traditional Media
13.5.5.1.1.1.Television
13.5.5.1.1.2.Radio
13.5.5.1.1.3.Print
13.5.5.1.1.3.1.Newspapers
13.5.5.1.1.3.2.Magazines
13.5.5.1.1.3.3.Others
13.5.5.1.1.4.Billboards
13.5.5.1.2.Digital Media
13.5.5.1.2.1.Online Display Ads
13.5.5.1.2.2.Social Media Ads
13.5.5.1.2.3.Search Engine Marketing (SEM)
13.5.5.1.2.3.1.Pay-per-click (PPC)
13.5.5.1.2.3.2.Display ads
13.5.5.1.2.3.3.Product Listing ads (PLAs)
13.5.5.1.2.4.Email Marketing
13.5.5.1.2.5.Programmatic Advertising
13.5.5.1.2.6.Over-the-Top (OTT) Advertising
13.5.5.1.2.7.Native ads
13.5.5.1.2.8.Interactive ads
13.5.5.1.2.9.Others
13.5.5.2.Australia Advertising Market Revenue (US$ Mn) and Forecasts, By Add Format
13.5.5.2.1.Text
13.5.5.2.2.Image
13.5.5.2.3.Video
13.5.5.2.4.Banners
13.5.5.2.5.Others
13.5.5.3.Australia Advertising Market Revenue (US$ Mn) and Forecasts, By Industry Verticals
13.5.5.3.1.Food and Beverage
13.5.5.3.2.Travel and Hospitality
13.5.5.3.3.Entertainment and Media
13.5.5.3.4.Real Estate
13.5.5.3.5.Education
13.5.5.3.6.Healthcare
13.5.5.3.7.Automotive
13.5.5.3.8.BSFI
13.5.5.3.9.Retail and Consumer Goods
13.5.5.3.10.IT and Technology
13.5.5.3.11.Others
13.5.6.South Korea
13.5.6.1.South Korea Advertising Market Revenue (US$ Mn) and Forecasts, By Platform
13.5.6.1.1.Traditional Media
13.5.6.1.1.1.Television
13.5.6.1.1.2.Radio
13.5.6.1.1.3.Print
13.5.6.1.1.3.1.Newspapers
13.5.6.1.1.3.2.Magazines
13.5.6.1.1.3.3.Others
13.5.6.1.1.4.Billboards
13.5.6.1.2.Digital Media
13.5.6.1.2.1.Online Display Ads
13.5.6.1.2.2.Social Media Ads
13.5.6.1.2.3.Search Engine Marketing (SEM)
13.5.6.1.2.3.1.Pay-per-click (PPC)
13.5.6.1.2.3.2.Display ads
13.5.6.1.2.3.3.Product Listing ads (PLAs)
13.5.6.1.2.4.Email Marketing
13.5.6.1.2.5.Programmatic Advertising
13.5.6.1.2.6.Over-the-Top (OTT) Advertising
13.5.6.1.2.7.Native ads
13.5.6.1.2.8.Interactive ads
13.5.6.1.2.9.Others
13.5.6.2.South Korea Advertising Market Revenue (US$ Mn) and Forecasts, By Add Format
13.5.6.2.1.Text
13.5.6.2.2.Image
13.5.6.2.3.Video
13.5.6.2.4.Banners
13.5.6.2.5.Others
13.5.6.3.South Korea Advertising Market Revenue (US$ Mn) and Forecasts, By Industry Verticals
13.5.6.3.1.Food and Beverage
13.5.6.3.2.Travel and Hospitality
13.5.6.3.3.Entertainment and Media
13.5.6.3.4.Real Estate
13.5.6.3.5.Education
13.5.6.3.6.Healthcare
13.5.6.3.7.Automotive
13.5.6.3.8.BSFI
13.5.6.3.9.Retail and Consumer Goods
13.5.6.3.10.IT and Technology
13.5.6.3.11.Others
13.5.7.Southeast Asia
13.5.7.1.Southeast Asia Advertising Market Revenue (US$ Mn) and Forecasts, By Platform
13.5.7.1.1.Traditional Media
13.5.7.1.1.1.Television
13.5.7.1.1.2.Radio
13.5.7.1.1.3.Print
13.5.7.1.1.3.1.Newspapers
13.5.7.1.1.3.2.Magazines
13.5.7.1.1.3.3.Others
13.5.7.1.1.4.Billboards
13.5.7.1.2.Digital Media
13.5.7.1.2.1.Online Display Ads
13.5.7.1.2.2.Social Media Ads
13.5.7.1.2.3.Search Engine Marketing (SEM)
13.5.7.1.2.3.1.Pay-per-click (PPC)
13.5.7.1.2.3.2.Display ads
13.5.7.1.2.3.3.Product Listing ads (PLAs)
13.5.7.1.2.4.Email Marketing
13.5.7.1.2.5.Programmatic Advertising
13.5.7.1.2.6.Over-the-Top (OTT) Advertising
13.5.7.1.2.7.Native ads
13.5.7.1.2.8.Interactive ads
13.5.7.1.2.9.Others
13.5.7.2.Southeast Asia Advertising Market Revenue (US$ Mn) and Forecasts, By Add Format
13.5.7.2.1.Text
13.5.7.2.2.Image
13.5.7.2.3.Video
13.5.7.2.4.Banners
13.5.7.2.5.Others
13.5.7.3.Southeast Asia Advertising Market Revenue (US$ Mn) and Forecasts, By Industry Verticals
13.5.7.3.1.Food and Beverage
13.5.7.3.2.Travel and Hospitality
13.5.7.3.3.Entertainment and Media
13.5.7.3.4.Real Estate
13.5.7.3.5.Education
13.5.7.3.6.Healthcare
13.5.7.3.7.Automotive
13.5.7.3.8.BSFI
13.5.7.3.9.Retail and Consumer Goods
13.5.7.3.10.IT and Technology
13.5.7.3.11.Others
13.5.7.4.Southeast Asia Advertising Market Revenue (US$ Mn) and Forecasts, By Country
13.5.7.4.1.Indonesia
13.5.7.4.2.Thailand
13.5.7.4.3.Malaysia
13.5.7.4.4.Singapore
13.5.7.4.5.Rest of Southeast Asia
13.5.8.Rest of Asia Pacific
13.5.8.1.Rest of Asia Pacific Advertising Market Revenue (US$ Mn) and Forecasts, By Platform
13.5.8.1.1.Traditional Media
13.5.8.1.1.1.Television
13.5.8.1.1.2.Radio
13.5.8.1.1.3.Print
13.5.8.1.1.3.1.Newspapers
13.5.8.1.1.3.2.Magazines
13.5.8.1.1.3.3.Others
13.5.8.1.1.4.Billboards
13.5.8.1.2.Digital Media
13.5.8.1.2.1.Online Display Ads
13.5.8.1.2.2.Social Media Ads
13.5.8.1.2.3.Search Engine Marketing (SEM)
13.5.8.1.2.3.1.Pay-per-click (PPC)
13.5.8.1.2.3.2.Display ads
13.5.8.1.2.3.3.Product Listing ads (PLAs)
13.5.8.1.2.4.Email Marketing
13.5.8.1.2.5.Programmatic Advertising
13.5.8.1.2.6.Over-the-Top (OTT) Advertising
13.5.8.1.2.7.Native ads
13.5.8.1.2.8.Interactive ads
13.5.8.1.2.9.Others
13.5.8.2.Rest of Asia Pacific Advertising Market Revenue (US$ Mn) and Forecasts, By Add Format
13.5.8.2.1.Text
13.5.8.2.2.Image
13.5.8.2.3.Video
13.5.8.2.4.Banners
13.5.8.2.5.Others
13.5.8.3.Rest of Asia Pacific Advertising Market Revenue (US$ Mn) and Forecasts, By Industry Verticals
13.5.8.3.1.Food and Beverage
13.5.8.3.2.Travel and Hospitality
13.5.8.3.3.Entertainment and Media
13.5.8.3.4.Real Estate
13.5.8.3.5.Education
13.5.8.3.6.Healthcare
13.5.8.3.7.Automotive
13.5.8.3.8.BSFI
13.5.8.3.9.Retail and Consumer Goods
13.5.8.3.10.IT and Technology
13.5.8.3.11.Others
13.6.Key Segment for Channeling Investments
13.6.1.By Country
13.6.2.By Platform
13.6.3.By Add Format
13.6.4.By Industry Verticals
14.Middle East and Africa Advertising Market Analysis and Forecasts, 2024 – 2034
14.1.Overview
14.1.1.Middle East and Africa Advertising Market Revenue (US$ Mn)
14.2.Middle East and Africa Advertising Market Revenue (US$ Mn) and Forecasts, By Platform
14.2.1.Traditional Media
14.2.1.1.Television
14.2.1.2.Radio
14.2.1.3.Print
14.2.1.3.1.Newspapers
14.2.1.3.2.Magazines
14.2.1.3.3.Others
14.2.1.4.Billboards
14.2.2.Digital Media
14.2.2.1.Online Display Ads
14.2.2.2.Social Media Ads
14.2.2.3.Search Engine Marketing (SEM)
14.2.2.3.1.Pay-per-click (PPC)
14.2.2.3.2.Display ads
14.2.2.3.3.Product Listing ads (PLAs)
14.2.2.4.Email Marketing
14.2.2.5.Programmatic Advertising
14.2.2.6.Over-the-Top (OTT) Advertising
14.2.2.7.Native ads
14.2.2.8.Interactive ads
14.2.2.9.Others
14.3.Middle East and Africa Advertising Market Revenue (US$ Mn) and Forecasts, By Add Format
14.3.1.Text
14.3.2.Image
14.3.3.Video
14.3.4.Banners
14.3.5.Others
14.4.Middle East and Africa Advertising Market Revenue (US$ Mn) and Forecasts, By Industry Verticals
14.4.1.Food and Beverage
14.4.2.Travel and Hospitality
14.4.3.Entertainment and Media
14.4.4.Real Estate
14.4.5.Education
14.4.6.Healthcare
14.4.7.Automotive
14.4.8.BSFI
14.4.9.Retail and Consumer Goods
14.4.10.IT and Technology
14.4.11.Others
14.5.Middle East and Africa Advertising Market Revenue (US$ Mn) and Forecasts, By Country
14.5.1.Saudi Arabia
14.5.1.1.Saudi Arabia Advertising Market Revenue (US$ Mn) and Forecasts, By Platform
14.5.1.1.1.Traditional Media
14.5.1.1.1.1.Television
14.5.1.1.1.2.Radio
14.5.1.1.1.3.Print
14.5.1.1.1.3.1.Newspapers
14.5.1.1.1.3.2.Magazines
14.5.1.1.1.3.3.Others
14.5.1.1.1.4.Billboards
14.5.1.1.2.Digital Media
14.5.1.1.2.1.Online Display Ads
14.5.1.1.2.2.Social Media Ads
14.5.1.1.2.3.Search Engine Marketing (SEM)
14.5.1.1.2.3.1.Pay-per-click (PPC)
14.5.1.1.2.3.2.Display ads
14.5.1.1.2.3.3.Product Listing ads (PLAs)
14.5.1.1.2.4.Email Marketing
14.5.1.1.2.5.Programmatic Advertising
14.5.1.1.2.6.Over-the-Top (OTT) Advertising
14.5.1.1.2.7.Native ads
14.5.1.1.2.8.Interactive ads
14.5.1.1.2.9.Others
14.5.1.2.Saudi Arabia Advertising Market Revenue (US$ Mn) and Forecasts, By Add Format
14.5.1.2.1.Text
14.5.1.2.2.Image
14.5.1.2.3.Video
14.5.1.2.4.Banners
14.5.1.2.5.Others
14.5.1.3.Saudi Arabia Advertising Market Revenue (US$ Mn) and Forecasts, By Industry Verticals
14.5.1.3.1.Food and Beverage
14.5.1.3.2.Travel and Hospitality
14.5.1.3.3.Entertainment and Media
14.5.1.3.4.Real Estate
14.5.1.3.5.Education
14.5.1.3.6.Healthcare
14.5.1.3.7.Automotive
14.5.1.3.8.BSFI
14.5.1.3.9.Retail and Consumer Goods
14.5.1.3.10.IT and Technology
14.5.1.3.11.Others
14.5.2.UAE
14.5.2.1.UAE Advertising Market Revenue (US$ Mn) and Forecasts, By Platform
14.5.2.1.1.Traditional Media
14.5.2.1.1.1.Television
14.5.2.1.1.2.Radio
14.5.2.1.1.3.Print
14.5.2.1.1.3.1.Newspapers
14.5.2.1.1.3.2.Magazines
14.5.2.1.1.3.3.Others
14.5.2.1.1.4.Billboards
14.5.2.1.2.Digital Media
14.5.2.1.2.1.Online Display Ads
14.5.2.1.2.2.Social Media Ads
14.5.2.1.2.3.Search Engine Marketing (SEM)
14.5.2.1.2.3.1.Pay-per-click (PPC)
14.5.2.1.2.3.2.Display ads
14.5.2.1.2.3.3.Product Listing ads (PLAs)
14.5.2.1.2.4.Email Marketing
14.5.2.1.2.5.Programmatic Advertising
14.5.2.1.2.6.Over-the-Top (OTT) Advertising
14.5.2.1.2.7.Native ads
14.5.2.1.2.8.Interactive ads
14.5.2.1.2.9.Others
14.5.2.2.UAE Advertising Market Revenue (US$ Mn) and Forecasts, By Add Format
14.5.2.2.1.Text
14.5.2.2.2.Image
14.5.2.2.3.Video
14.5.2.2.4.Banners
14.5.2.2.5.Others
14.5.2.3.UAE Advertising Market Revenue (US$ Mn) and Forecasts, By Industry Verticals
14.5.2.3.1.Food and Beverage
14.5.2.3.2.Travel and Hospitality
14.5.2.3.3.Entertainment and Media
14.5.2.3.4.Real Estate
14.5.2.3.5.Education
14.5.2.3.6.Healthcare
14.5.2.3.7.Automotive
14.5.2.3.8.BSFI
14.5.2.3.9.Retail and Consumer Goods
14.5.2.3.10.IT and Technology
14.5.2.3.11.Others
14.5.3.Egypt
14.5.3.1.Egypt Advertising Market Revenue (US$ Mn) and Forecasts, By Platform
14.5.3.1.1.Traditional Media
14.5.3.1.1.1.Television
14.5.3.1.1.2.Radio
14.5.3.1.1.3.Print
14.5.3.1.1.3.1.Newspapers
14.5.3.1.1.3.2.Magazines
14.5.3.1.1.3.3.Others
14.5.3.1.1.4.Billboards
14.5.3.1.2.Digital Media
14.5.3.1.2.1.Online Display Ads
14.5.3.1.2.2.Social Media Ads
14.5.3.1.2.3.Search Engine Marketing (SEM)
14.5.3.1.2.3.1.Pay-per-click (PPC)
14.5.3.1.2.3.2.Display ads
14.5.3.1.2.3.3.Product Listing ads (PLAs)
14.5.3.1.2.4.Email Marketing
14.5.3.1.2.5.Programmatic Advertising
14.5.3.1.2.6.Over-the-Top (OTT) Advertising
14.5.3.1.2.7.Native ads
14.5.3.1.2.8.Interactive ads
14.5.3.1.2.9.Others
14.5.3.2.Egypt Advertising Market Revenue (US$ Mn) and Forecasts, By Add Format
14.5.3.2.1.Text
14.5.3.2.2.Image
14.5.3.2.3.Video
14.5.3.2.4.Banners
14.5.3.2.5.Others
14.5.3.3.Egypt Advertising Market Revenue (US$ Mn) and Forecasts, By Industry Verticals
14.5.3.3.1.Food and Beverage
14.5.3.3.2.Travel and Hospitality
14.5.3.3.3.Entertainment and Media
14.5.3.3.4.Real Estate
14.5.3.3.5.Education
14.5.3.3.6.Healthcare
14.5.3.3.7.Automotive
14.5.3.3.8.BSFI
14.5.3.3.9.Retail and Consumer Goods
14.5.3.3.10.IT and Technology
14.5.3.3.11.Others
14.5.4.Kuwait
14.5.4.1.Kuwait Advertising Market Revenue (US$ Mn) and Forecasts, By Platform
14.5.4.1.1.Traditional Media
14.5.4.1.1.1.Television
14.5.4.1.1.2.Radio
14.5.4.1.1.3.Print
14.5.4.1.1.3.1.Newspapers
14.5.4.1.1.3.2.Magazines
14.5.4.1.1.3.3.Others
14.5.4.1.1.4.Billboards
14.5.4.1.2.Digital Media
14.5.4.1.2.1.Online Display Ads
14.5.4.1.2.2.Social Media Ads
14.5.4.1.2.3.Search Engine Marketing (SEM)
14.5.4.1.2.3.1.Pay-per-click (PPC)
14.5.4.1.2.3.2.Display ads
14.5.4.1.2.3.3.Product Listing ads (PLAs)
14.5.4.1.2.4.Email Marketing
14.5.4.1.2.5.Programmatic Advertising
14.5.4.1.2.6.Over-the-Top (OTT) Advertising
14.5.4.1.2.7.Native ads
14.5.4.1.2.8.Interactive ads
14.5.4.1.2.9.Others
14.5.4.2.Kuwait Advertising Market Revenue (US$ Mn) and Forecasts, By Add Format
14.5.4.2.1.Text
14.5.4.2.2.Image
14.5.4.2.3.Video
14.5.4.2.4.Banners
14.5.4.2.5.Others
14.5.4.3.Kuwait Advertising Market Revenue (US$ Mn) and Forecasts, By Industry Verticals
14.5.4.3.1.Food and Beverage
14.5.4.3.2.Travel and Hospitality
14.5.4.3.3.Entertainment and Media
14.5.4.3.4.Real Estate
14.5.4.3.5.Education
14.5.4.3.6.Healthcare
14.5.4.3.7.Automotive
14.5.4.3.8.BSFI
14.5.4.3.9.Retail and Consumer Goods
14.5.4.3.10.IT and Technology
14.5.4.3.11.Others
14.5.5.South Africa
14.5.5.1.South Africa Advertising Market Revenue (US$ Mn) and Forecasts, By Platform
14.5.5.1.1.Traditional Media
14.5.5.1.1.1.Television
14.5.5.1.1.2.Radio
14.5.5.1.1.3.Print
14.5.5.1.1.3.1.Newspapers
14.5.5.1.1.3.2.Magazines
14.5.5.1.1.3.3.Others
14.5.5.1.1.4.Billboards
14.5.5.1.2.Digital Media
14.5.5.1.2.1.Online Display Ads
14.5.5.1.2.2.Social Media Ads
14.5.5.1.2.3.Search Engine Marketing (SEM)
14.5.5.1.2.3.1.Pay-per-click (PPC)
14.5.5.1.2.3.2.Display ads
14.5.5.1.2.3.3.Product Listing ads (PLAs)
14.5.5.1.2.4.Email Marketing
14.5.5.1.2.5.Programmatic Advertising
14.5.5.1.2.6.Over-the-Top (OTT) Advertising
14.5.5.1.2.7.Native ads
14.5.5.1.2.8.Interactive ads
14.5.5.1.2.9.Others
14.5.5.2.South Africa Advertising Market Revenue (US$ Mn) and Forecasts, By Add Format
14.5.5.2.1.Text
14.5.5.2.2.Image
14.5.5.2.3.Video
14.5.5.2.4.Banners
14.5.5.2.5.Others
14.5.5.3.South Africa Advertising Market Revenue (US$ Mn) and Forecasts, By Industry Verticals
14.5.5.3.1.Food and Beverage
14.5.5.3.2.Travel and Hospitality
14.5.5.3.3.Entertainment and Media
14.5.5.3.4.Real Estate
14.5.5.3.5.Education
14.5.5.3.6.Healthcare
14.5.5.3.7.Automotive
14.5.5.3.8.BSFI
14.5.5.3.9.Retail and Consumer Goods
14.5.5.3.10.IT and Technology
14.5.5.3.11.Others
14.5.6.Rest of Middle East & Africa
14.5.6.1.Rest of Middle East & Africa Advertising Market Revenue (US$ Mn) and Forecasts, By Platform
14.5.6.1.1.Traditional Media
14.5.6.1.1.1.Television
14.5.6.1.1.2.Radio
14.5.6.1.1.3.Print
14.5.6.1.1.3.1.Newspapers
14.5.6.1.1.3.2.Magazines
14.5.6.1.1.3.3.Others
14.5.6.1.1.4.Billboards
14.5.6.1.2.Digital Media
14.5.6.1.2.1.Online Display Ads
14.5.6.1.2.2.Social Media Ads
14.5.6.1.2.3.Search Engine Marketing (SEM)
14.5.6.1.2.3.1.Pay-per-click (PPC)
14.5.6.1.2.3.2.Display ads
14.5.6.1.2.3.3.Product Listing ads (PLAs)
14.5.6.1.2.4.Email Marketing
14.5.6.1.2.5.Programmatic Advertising
14.5.6.1.2.6.Over-the-Top (OTT) Advertising
14.5.6.1.2.7.Native ads
14.5.6.1.2.8.Interactive ads
14.5.6.1.2.9.Others
14.5.6.2.Rest of Middle East & Africa Advertising Market Revenue (US$ Mn) and Forecasts, By Add Format
14.5.6.2.1.Text
14.5.6.2.2.Image
14.5.6.2.3.Video
14.5.6.2.4.Banners
14.5.6.2.5.Others
14.5.6.3.Rest of Middle East & Africa Advertising Market Revenue (US$ Mn) and Forecasts, By Industry Verticals
14.5.6.3.1.Food and Beverage
14.5.6.3.2.Travel and Hospitality
14.5.6.3.3.Entertainment and Media
14.5.6.3.4.Real Estate
14.5.6.3.5.Education
14.5.6.3.6.Healthcare
14.5.6.3.7.Automotive
14.5.6.3.8.BSFI
14.5.6.3.9.Retail and Consumer Goods
14.5.6.3.10.IT and Technology
14.5.6.3.11.Others
14.6.Key Segment for Channeling Investments
14.6.1.By Country
14.6.2.By Platform
14.6.3.By Add Format
14.6.4.By Industry Verticals
15.Latin America Advertising Market Analysis and Forecasts, 2024 – 2034
15.1.Overview
15.1.1.Latin America Advertising Market Revenue (US$ Mn)
15.2.Latin America Advertising Market Revenue (US$ Mn) and Forecasts, By Platform
15.2.1.Traditional Media
15.2.1.1.Television
15.2.1.2.Radio
15.2.1.3.Print
15.2.1.3.1.Newspapers
15.2.1.3.2.Magazines
15.2.1.3.3.Others
15.2.1.4.Billboards
15.2.2.Digital Media
15.2.2.1.Online Display Ads
15.2.2.2.Social Media Ads
15.2.2.3.Search Engine Marketing (SEM)
15.2.2.3.1.Pay-per-click (PPC)
15.2.2.3.2.Display ads
15.2.2.3.3.Product Listing ads (PLAs)
15.2.2.4.Email Marketing
15.2.2.5.Programmatic Advertising
15.2.2.6.Over-the-Top (OTT) Advertising
15.2.2.7.Native ads
15.2.2.8.Interactive ads
15.2.2.9.Others
15.3.Latin America Advertising Market Revenue (US$ Mn) and Forecasts, By Add Format
15.3.1.Text
15.3.2.Image
15.3.3.Video
15.3.4.Banners
15.3.5.Others
15.4.Latin America Advertising Market Revenue (US$ Mn) and Forecasts, By Industry Verticals
15.4.1.Food and Beverage
15.4.2.Travel and Hospitality
15.4.3.Entertainment and Media
15.4.4.Real Estate
15.4.5.Education
15.4.6.Healthcare
15.4.7.Automotive
15.4.8.BSFI
15.4.9.Retail and Consumer Goods
15.4.10.IT and Technology
15.4.11.Others
15.5.Latin America Advertising Market Revenue (US$ Mn) and Forecasts, By Country
15.5.1.Brazil
15.5.1.1.Brazil Advertising Market Revenue (US$ Mn) and Forecasts, By Platform
15.5.1.1.1.Traditional Media
15.5.1.1.1.1.Television
15.5.1.1.1.2.Radio
15.5.1.1.1.3.Print
15.5.1.1.1.3.1.Newspapers
15.5.1.1.1.3.2.Magazines
15.5.1.1.1.3.3.Others
15.5.1.1.1.4.Billboards
15.5.1.1.2.Digital Media
15.5.1.1.2.1.Online Display Ads
15.5.1.1.2.2.Social Media Ads
15.5.1.1.2.3.Search Engine Marketing (SEM)
15.5.1.1.2.3.1.Pay-per-click (PPC)
15.5.1.1.2.3.2.Display ads
15.5.1.1.2.3.3.Product Listing ads (PLAs)
15.5.1.1.2.4.Email Marketing
15.5.1.1.2.5.Programmatic Advertising
15.5.1.1.2.6.Over-the-Top (OTT) Advertising
15.5.1.1.2.7.Native ads
15.5.1.1.2.8.Interactive ads
15.5.1.1.2.9.Others
15.5.1.2.Brazil Advertising Market Revenue (US$ Mn) and Forecasts, By Add Format
15.5.1.2.1.Text
15.5.1.2.2.Image
15.5.1.2.3.Video
15.5.1.2.4.Banners
15.5.1.2.5.Others
15.5.1.3.Brazil Advertising Market Revenue (US$ Mn) and Forecasts, By Industry Verticals
15.5.1.3.1.Food and Beverage
15.5.1.3.2.Travel and Hospitality
15.5.1.3.3.Entertainment and Media
15.5.1.3.4.Real Estate
15.5.1.3.5.Education
15.5.1.3.6.Healthcare
15.5.1.3.7.Automotive
15.5.1.3.8.BSFI
15.5.1.3.9.Retail and Consumer Goods
15.5.1.3.10.IT and Technology
15.5.1.3.11.Others
15.5.2.Argentina
15.5.2.1.Argentina Advertising Market Revenue (US$ Mn) and Forecasts, By Platform
15.5.2.1.1.Traditional Media
15.5.2.1.1.1.Television
15.5.2.1.1.2.Radio
15.5.2.1.1.3.Print
15.5.2.1.1.3.1.Newspapers
15.5.2.1.1.3.2.Magazines
15.5.2.1.1.3.3.Others
15.5.2.1.1.4.Billboards
15.5.2.1.2.Digital Media
15.5.2.1.2.1.Online Display Ads
15.5.2.1.2.2.Social Media Ads
15.5.2.1.2.3.Search Engine Marketing (SEM)
15.5.2.1.2.3.1.Pay-per-click (PPC)
15.5.2.1.2.3.2.Display ads
15.5.2.1.2.3.3.Product Listing ads (PLAs)
15.5.2.1.2.4.Email Marketing
15.5.2.1.2.5.Programmatic Advertising
15.5.2.1.2.6.Over-the-Top (OTT) Advertising
15.5.2.1.2.7.Native ads
15.5.2.1.2.8.Interactive ads
15.5.2.1.2.9.Others
15.5.2.2.Argentina Advertising Market Revenue (US$ Mn) and Forecasts, By Add Format
15.5.2.2.1.Text
15.5.2.2.2.Image
15.5.2.2.3.Video
15.5.2.2.4.Banners
15.5.2.2.5.Others
15.5.2.3.Argentina Advertising Market Revenue (US$ Mn) and Forecasts, By Industry Verticals
15.5.2.3.1.Food and Beverage
15.5.2.3.2.Travel and Hospitality
15.5.2.3.3.Entertainment and Media
15.5.2.3.4.Real Estate
15.5.2.3.5.Education
15.5.2.3.6.Healthcare
15.5.2.3.7.Automotive
15.5.2.3.8.BSFI
15.5.2.3.9.Retail and Consumer Goods
15.5.2.3.10.IT and Technology
15.5.2.3.11.Others
15.5.3.Rest of Latin America
15.5.3.1.Rest of Latin America Advertising Market Revenue (US$ Mn) and Forecasts, By Platform
15.5.3.1.1.Traditional Media
15.5.3.1.1.1.Television
15.5.3.1.1.2.Radio
15.5.3.1.1.3.Print
15.5.3.1.1.3.1.Newspapers
15.5.3.1.1.3.2.Magazines
15.5.3.1.1.3.3.Others
15.5.3.1.1.4.Billboards
15.5.3.1.2.Digital Media
15.5.3.1.2.1.Online Display Ads
15.5.3.1.2.2.Social Media Ads
15.5.3.1.2.3.Search Engine Marketing (SEM)
15.5.3.1.2.3.1.Pay-per-click (PPC)
15.5.3.1.2.3.2.Display ads
15.5.3.1.2.3.3.Product Listing ads (PLAs)
15.5.3.1.2.4.Email Marketing
15.5.3.1.2.5.Programmatic Advertising
15.5.3.1.2.6.Over-the-Top (OTT) Advertising
15.5.3.1.2.7.Native ads
15.5.3.1.2.8.Interactive ads
15.5.3.1.2.9.Others
15.5.3.2.Rest of Latin America Advertising Market Revenue (US$ Mn) and Forecasts, By Add Format
15.5.3.2.1.Text
15.5.3.2.2.Image
15.5.3.2.3.Video
15.5.3.2.4.Banners
15.5.3.2.5.Others
15.5.3.3.Rest of Latin America Advertising Market Revenue (US$ Mn) and Forecasts, By Industry Verticals
15.5.3.3.1.Food and Beverage
15.5.3.3.2.Travel and Hospitality
15.5.3.3.3.Entertainment and Media
15.5.3.3.4.Real Estate
15.5.3.3.5.Education
15.5.3.3.6.Healthcare
15.5.3.3.7.Automotive
15.5.3.3.8.BSFI
15.5.3.3.9.Retail and Consumer Goods
15.5.3.3.10.IT and Technology
15.5.3.3.11.Others
15.6.Key Segment for Channeling Investments
15.6.1.By Country
15.6.2.By Platform
15.6.3.By Add Format
15.6.4.By Industry Verticals
16.Competitive Benchmarking
16.1.Brand Benchmarking
16.2.Market Share Analysis, 2023
16.3.Global Presence and Growth Strategies
16.3.1.Mergers and Acquisitions
16.3.2.Product Launches
16.3.3.Investments Trends
16.3.4.R&D Initiatives
17.Player Profiles
17.1.Dentsu Inc.
17.1.1.Company Details
17.1.2.Company Overview
17.1.3.Product Offerings
17.1.4.Key Developments
17.1.5.Financial Analysis
17.1.6.SWOT Analysis
17.1.7.Business Strategies
17.2.DIGITAS
17.2.1.Company Details
17.2.2.Company Overview
17.2.3.Product Offerings
17.2.4.Key Developments
17.2.5.Financial Analysis
17.2.6.SWOT Analysis
17.2.7.Business Strategies
17.3.GroupM
17.3.1.Company Details
17.3.2.Company Overview
17.3.3.Product Offerings
17.3.4.Key Developments
17.3.5.Financial Analysis
17.3.6.SWOT Analysis
17.3.7.Business Strategies
17.4.Havas
17.4.1.Company Details
17.4.2.Company Overview
17.4.3.Product Offerings
17.4.4.Key Developments
17.4.5.Financial Analysis
17.4.6.SWOT Analysis
17.4.7.Business Strategies
17.5.IPG
17.5.1.Company Details
17.5.2.Company Overview
17.5.3.Product Offerings
17.5.4.Key Developments
17.5.5.Financial Analysis
17.5.6.SWOT Analysis
17.5.7.Business Strategies
17.6.Omnicom Group Inc. 
17.6.1.Company Details
17.6.2.Company Overview
17.6.3.Product Offerings
17.6.4.Key Developments
17.6.5.Financial Analysis
17.6.6.SWOT Analysis
17.6.7.Business Strategies
17.7.Publicis Groupe
17.7.1.Company Details
17.7.2.Company Overview
17.7.3.Product Offerings
17.7.4.Key Developments
17.7.5.Financial Analysis
17.7.6.SWOT Analysis
17.7.7.Business Strategies
17.8.R.R. Donnelley & Sons Company
17.8.1.Company Details
17.8.2.Company Overview
17.8.3.Product Offerings
17.8.4.Key Developments
17.8.5.Financial Analysis
17.8.6.SWOT Analysis
17.8.7.Business Strategies
17.9.Weber Shandwick
17.9.1.Company Details
17.9.2.Company Overview
17.9.3.Product Offerings
17.9.4.Key Developments
17.9.5.Financial Analysis
17.9.6.SWOT Analysis
17.9.7.Business Strategies
17.10.WPP Group PLC
17.10.1.Company Details
17.10.2.Company Overview
17.10.3.Product Offerings
17.10.4.Key Developments
17.10.5.Financial Analysis
17.10.6.SWOT Analysis
17.10.7.Business Strategies
17.11.Other Industry Participants
18.Key Findings

.


Note: This ToC is tentative and can be changed according to the research study conducted during the course of report completion.

.

**Exclusive for Multi-User and Enterprise User.

.

Global Advertising Market

By Platform

  • Traditional Media
    • Television
    • Radio
    • Print
      • Newspapers
      • Magazines
      • Others
    • Billboards
  • Digital Media
    • Online Display Ads
    • Social Media Ads
    • Search Engine Marketing (SEM)
      • Pay-per-click (PPC)
      • Display ads
      • Product Listing ads (PLAs)
    • Email Marketing
    • Programmatic Advertising
    • Over-the-Top (OTT) Advertising
    • Native ads
    • Interactive ads
    • Others

By Add Format

  • Text
  • Image
  • Video
  • Banners
  • Others

By Industry Vertical

  • Food and Beverage
  • Travel and Hospitality
  • Entertainment and Media
  • Real Estate
  • Education
  • Healthcare
  • Automotive
  • BSFI
  • Retail and Consumer Goods
  • IT and Technology
  • Others

By Region

  • North America (U.S., Canada, Mexico, Rest of North America)
  • Europe (France, The UK, Spain, Germany, Italy, Nordic Countries (Denmark, Finland, Iceland, Sweden, Norway), Benelux Union (Belgium, The Netherlands, Luxembourg), Rest of Europe)
  • Asia Pacific (China, Japan, India, New Zealand, Australia, South Korea, Southeast Asia (Indonesia, Thailand, Malaysia, Singapore, Rest of Southeast Asia), Rest of Asia Pacific)
  • Middle East & Africa (Saudi Arabia, UAE, Egypt, Kuwait, South Africa, Rest of Middle East & Africa)
  • Latin America (Brazil, Argentina, Rest of Latin America)

The Niche Research approach encompasses both primary and secondary research methods to provide comprehensive insights. While primary research is the cornerstone of our studies, we also incorporate secondary research sources such as company annual reports, premium industry databases, press releases, industry journals, and white papers.

Within our primary research, we actively engage with various industry stakeholders, conducting paid interviews and surveys. Our meticulous analysis extends to every market participant in major countries, allowing us to thoroughly examine their portfolios, calculate market shares, and segment revenues.

Our data collection primarily focuses on individual countries within our research scope, enabling us to estimate regional market sizes. Typically, we employ a bottom-up approach, meticulously tracking trends in different countries. We analyze growth drivers, constraints, technological innovations, and opportunities for each country, ultimately arriving at regional figures.Our process begins by examining the growth prospects of each country. Building upon these insights, we project growth and trends for the entire region. Finally, we utilize our proprietary model to refine estimations and forecasts.

Our data validation standards are integral to ensuring the reliability and accuracy of our research findings. Here’s a breakdown of our data validation processes and the stakeholders we engage with during our primary research:

  • Supply Side Analysis: We initiate a supply side analysis by directly contacting market participants, through telephonic interviews and questionnaires containing both open-ended and close-ended questions. We gather information on their portfolios, segment revenues, developments, and growth strategies.
  • Demand Side Analysis: To gain insights into adoption trends and consumer preferences, we reach out to target customers and users (non-vendors). This information forms a vital part of the qualitative analysis section of our reports, covering market dynamics, adoption trends, consumer behavior, spending patterns, and other related aspects.
  • Consultant Insights: We tap into the expertise of our partner consultants from around the world to obtain their unique viewpoints and perspectives. Their insights contribute to a well-rounded understanding of the markets under investigation.
  • In-House Validation: To ensure data accuracy and reliability, we conduct cross-validation of data points and information through our in-house team of consultants and utilize advanced data modeling tools for thorough verification.

The forecasts we provide are based on a comprehensive assessment of various factors, including:

  • Market Trends and Past Performance (Last Five Years): We accurately analyze market trends and performance data from preceding five years to identify historical patterns and understand the market’s evolution.
  • Historical Performance and Growth of Market Participants: We assess the historical performance and growth trajectories of key market participants. This analysis provides insights into the competitive landscape and individual company strategies.
  • Market Determinants Impact Analysis (Next Eight Years): We conduct a rigorous analysis of the factors that are projected to influence the market over the next eight years. This includes assessing both internal and external determinants that can shape market dynamics.
  • Drivers and Challenges for the Forecast Period:Identify the factors expected to drive market growth during the forecast period, as well as the challenges that the industry may face. This analysis aids in deriving an accurate growth rate projection.
  • New Acquisitions, Collaborations, or Partnerships: We keep a close watch on any new acquisitions, collaborations, or partnerships within the industry. These developments can have a significant impact on market dynamics and competitiveness.
  • Macro and Micro Factors Analysis:A thorough examination of both macro-level factors (e.g., economic trends, regulatory changes) and micro-level factors (e.g., technological advancements, consumer preferences) that may influence the market during the forecast period.
  • End-User Sentiment Analysis: To understand the market from the end-user perspective, we conduct sentiment analysis. This involves assessing the sentiment, preferences, and feedback of the end-users, which can provide valuable insights into market trends.
  • Perspective of Primary Participants: Insights gathered directly from primary research participants play a crucial role in shaping our forecasts. Their perspectives and experiences provide valuable qualitative data.
  • Year-on-Year Growth Trend: We utilize a year-on-year growth trend based on historical market growth and expected future trends. This helps in formulating our growth projections, aligning them with the market’s historical performance.

Research process adopted by TNR involves multiple stages, including data collection, validation, quality checks, and presentation. It’s crucial that the data and information we provide add value to your existing market understanding and expertise. We have also established partnerships with business consulting, research, and survey organizations across regions and globally to collaborate on regional analysis and data validation, ensuring the highest level of accuracy and reliability in our reports.


Procure Comprehensive Study of

Global Advertising Market

Online Only

  • Online Access
  • Read Only File
  • Validity 3 Months
  • Print, Copy, Paste & Download
  • PPT, Excel
  • Cost-Free Report in the Next Update
$3300
Buy Now

Single User

  • Access to One User on One System
  • Read Only File
  • Validity 6 Months
  • Limited Print,Copy, Paste
  • PPT, Excel
  • Cost-Free Report in the Next Update
$4200
Buy Now

Multi User

  • Access to Fiver Users
  • PDF File
  • Validity 1 Year
  • Upto FivePrints
  • Cost-Free Report in the Next Update
  • PPT, Excel
$6000
Buy Now

Enterprise User

  • Access to Unlimited Users
  • PDF, PPT, Excel
  • Unlimited Validity, Prints&Downloads
  • 1 Hour Cost-Free & Dedicated Analyst Support
  • 10% Cost-Free Customization
  • Cost-Free Report Update Twice in a Year
  • Recommendations for Business Strategies
  • Authorization to Quote TNR, The Niche Research
$7300
Buy Now

Library Access

  • Online Access to Content Publications
  • Access Player Profiles Online
  • Get Immediate Access to Newly Added Content
  • Acquire 12 PDF Downloads
  • Acquire 5 Excel Data Sets
  • Gain Access to 290+ PDFs of Company Profiles
  • Round-the-clock Email and Phone Assistance
  • Dashboard Usage and Trends
  • Renewal & Upgrade Assistance
  • Assessing Customization Options and Alerts for New Reports
$10788
Buy Now
*Taxes/Fees, if applicable will be added during checkout. All prices in USD

Why TNR The Niche Research?

  • Unwavering Commitment to Excellence

  • Veteran Team of Researchers

  • Accurate and Timely Insights

  • Ethical Practices and Customized Service

  • Uninterrupted Availability Around the Clock

Scroll to Top