Global Carbon Capture and Sequestration Market Insights, Growth, Share, Size: By Type, By Industry, By Region Forecast, 2024-2034, Competitive Landscape and Trends
- Industry: Energy & Power
- Report ID: TNR-110-1072
- Number of Pages: 420
- Table/Charts : Yes
- April, 2024
- Base Year : 2024
- No. of Companies : 10+
- No. of Countries : 29
- Views : 10118
- Covid Impact Covered: Yes
- War Impact Covered: Yes
- Formats : PDF, Excel, PPT
Carbon Capture and Sequestration (CCS) is a technology designed to mitigate greenhouse gas emissions, particularly carbon dioxide (CO2), from large point sources such as power plants and industrial facilities. The process involves capturing CO2 emissions produced from burning fossil fuels or other industrial processes, transporting it to a storage site, and securely storing it underground or utilizing it in other applications. A breakdown of the key steps involved in carbon capture and sequestration market are:
- Capture: CO2 is captured from industrial processes or directly from the air using various technologies such as absorption, adsorption, or membrane separation. The captured CO2 is then purified to remove impurities before further processing.
- Transport: Once captured, the CO2 is transported via pipelines, ships, or trucks to suitable storage sites. This transportation process requires careful planning to ensure safety and efficiency.
- Storage: The CO2 is injected deep underground into geological formations such as depleted oil and gas reservoirs, saline aquifers, or unminable coal seams. These geological formations act as natural traps, securely storing the CO2 to prevent it from re-entering the atmosphere.
The primary goal of carbon capture and sequestration is to reduce CO2 emissions into the atmosphere, thereby mitigating climate change. By capturing and storing CO2 emissions from industrial sources, CCS can help industries transition to cleaner energy sources while minimizing their environmental impact.
Global Carbon Capture and Sequestration Market Revenue & Forecast, (US$ Million), 2016 – 2034
One of the key trends driving the growth of the carbon capture and sequestration market is increasing environmental regulations and policies aimed at reducing greenhouse gas emissions. Government bodies around the world are implementing stringent emission reduction targets and introducing various incentives and subsidies to promote the adoption of CCS technologies. This regulatory push has created a favorable environment for CCS projects and investments, driving market growth.
Another significant driver of the carbon capture and sequestration market is the growing awareness among industries and businesses about the importance of sustainability and corporate social responsibility. Many companies are voluntarily investing in CCS technologies as a part of their efforts to reduce carbon footprint and demonstrate their commitment to environmental stewardship. This trend is particularly evident in industries with high carbon emissions, such as power generation, cement production, and oil and gas.
While the global carbon capture and sequestration market is experiencing growth, it is not without its challenges and restraints. Several factors are likely to impede the widespread adoption and deployment of CCS technologies. One significant restraint is the high cost associated with implementing CCS projects. The upfront capital investment required to build carbon capture facilities, retrofit existing infrastructure, and establish CO2 transportation and storage infrastructure can be substantial. Additionally, the operational and maintenance costs of CCS facilities are often considerable. These high costs pose a barrier to entry for many industries, particularly in sectors with narrow profit margins or limited access to financing. Another restraint is the lack of widespread public acceptance and social license for CCS projects. Concerns about potential environmental and health risks associated with CO2 storage, such as groundwater contamination and induced seismicity, can lead to opposition from local communities and environmental groups.
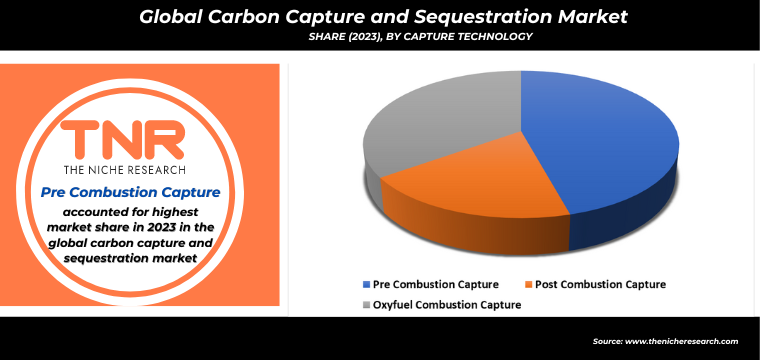
In 2023, the pre-combustion carbon capture technology emerged as a dominant force in the carbon capture and sequestration market, commanding a major market share of ~45.3% globally. This prominence can be attributed to its versatility and effectiveness across a broad spectrum of industries, ranging from power generation to industrial manufacturing processes. Pre-combustion capture entails the extraction of carbon dioxide (CO2) from fuel or feedstock before undergoing combustion, typically through processes like gasification or reforming. This approach offers several advantages, including higher capture rates and enhanced efficiency compared to post-combustion methods, where CO2 is captured from flue gases after combustion has occurred. Industries, particularly those operating coal-fired power plants or heavy manufacturing facilities, can readily retrofit their operations to incorporate pre-combustion capture with minimal modifications. This compatibility facilitates the reduction of emissions without necessitating significant overhauls of established systems, making it a compelling option for companies seeking to address their carbon footprint while maintaining operational continuity.
In 2023, the chemical segment emerged as a dominant force in the carbon capture and sequestration market, holding a substantial share attributable to several key drivers. Within the chemical industry, stringent emission reduction targets and sustainability initiatives have accelerated the adoption of CCS technologies. Chemical manufacturing processes often produce significant amounts of carbon dioxide (CO2) emissions, compelling companies to integrate CCS solutions directly into their operations. This strategic move not only helps them meet regulatory requirements but also aligns with their corporate sustainability goals, enhancing their reputation and competitiveness in the market. Moreover, government incentives and funding support have incentivized chemical companies to invest in CCS infrastructure, offsetting the initial capital costs and making CCS implementation economically viable. Technological advancements in CCS, including improved capture processes and optimized storage solutions, have further bolstered the attractiveness of CCS for chemical manufacturers, driving its widespread adoption across the carbon capture and sequestration market. As the demand for environmentally friendly products continues to rise, the chemical sector’s commitment to reducing its carbon footprint through CCS technologies is expected to remain steadfast, solidifying its dominant position in the global carbon capture and sequestration market landscape.

North America continued to lead the global carbon capture and sequestration market in 2023, accounting for a substantial share of total CCS capacity worldwide. According to data gathered, North America accounted for approximately 45% of total CCS capacity in operation or under development globally. The United States, in particular, stood out as a key driver of CCS deployment, with numerous large-scale CCS projects across various sectors, including power generation, oil and gas production, and industrial manufacturing. Canada also played a significant role in the region’s CCS leadership, with several projects focused on carbon capture and storage in Alberta’s oil sands industry. Additionally, North America’s commitment to CCS was underscored by substantial government support and funding initiatives. For instance, the United States allocated over $6 billion in federal funding for CCS research, development, and deployment as part of its climate change mitigation efforts. With a combination of technological innovation, regulatory support, and financial investment, North America maintained its dominant position in the global carbon capture and sequestration market, driving progress towards decarbonization goals and sustainability targets.
Competitors: Global Carbon Capture and Sequestration Market
- Aker Solutions
- Chevron Corporation
- Climeworks
- Drax Group
- Equinor ASA
- Exxon Mobil Corporation
- Fluor Corporation
- Halliburton
- Honeywell International Inc.
- Linde plc
- MITSUBISHI HEAVY INDUSTRIES, LTD.
- Royal Dutch Shell plc
- Saipem
- Schlumberger Limited.
- Other Market Participants
Global Carbon Capture and Sequestration Market
| Report Specifications | Details |
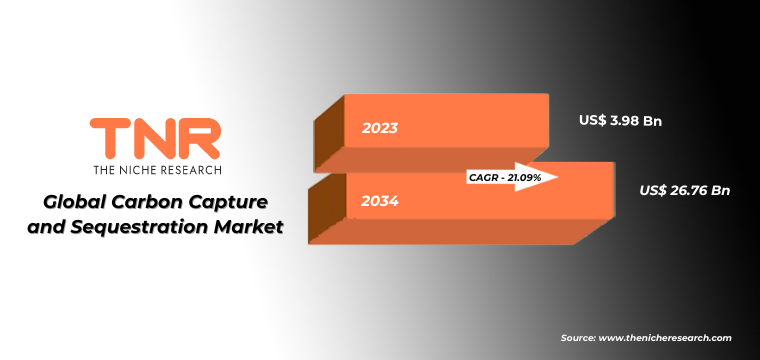
| Market Revenue in 2023 | US$ 3.98 Bn |
| Market Size Forecast by 2034 | US$ 26.76 Bn |
| Growth Rate (CAGR) | 21.09% |
| Historic Data | 2016 – 2022 |
| Base Year for Estimation | 2023 |
| Forecast Period | 2024 – 2034 |
| Report Inclusions | Market Size & Estimates, Market Dynamics, Competitive Scenario, Trends, Growth Factors, Market Determinants, Key Investment Segmentation, Product/Service/Solutions Benchmarking |
| Segments Covered | By Type, By Industry |
| Regions Covered | North America, Europe, Asia Pacific, Middle East & Africa, Latin America |
| Countries Covered | U.S., Canada, Mexico, Rest of North America, France, The UK, Spain, Germany, Italy, Nordic Countries (Denmark, Finland, Iceland, Sweden, Norway), Benelux Union (Belgium, The Netherlands, Luxembourg), Rest of Europe, China, Japan, India, New Zealand, Australia, South Korea, Southeast Asia (Indonesia, Thailand, Malaysia, Singapore, Rest of Southeast Asia), Rest of Asia Pacific, Saudi Arabia, UAE, Egypt, Kuwait, South Africa, Rest of Middle East & Africa, Brazil, Argentina, Rest of Latin America |
| Key Players | Aker Solutions, Chevron Corporation, Climeworks, Drax Group, Equinor ASA, Exxon Mobil Corporation, Fluor Corporation., Halliburton, Honeywell International Inc., Linde plc, MITSUBISHI HEAVY INDUSTRIES, LTD., Royal Dutch Shell plc, Saipem, Schlumberger Limited., Other Market Participants |
| Customization Scope | Customization allows for the inclusion/modification of content pertaining to geographical regions, countries, and specific market segments. |
| Pricing & Procurement Options | Explore purchase options tailored to your specific research requirements |
| Contact Details | Consult With Our Expert
Japan (Toll-Free): +81 663-386-8111 South Korea (Toll-Free): +82-808- 703-126 Saudi Arabia (Toll-Free): +966 800-850-1643 United Kingdom: +44 753-710-5080 United States: +1 302-232-5106 E-mail: askanexpert@thenicheresearch.com
|
Global Carbon Capture and Sequestration Market Scope
By Type
- Capture
- Pre Combustion Capture
- Post Combustion Capture
- Oxyfuel Combustion Capture
- Transportation
- Storage
By Industry
- Chemicals
- Oil & Gas
- Biofuels
- Iron and Steel
- Power Generation
- Cement
- Waste Management and Waste-to-Energy
- Others
By Region
- North America (U.S., Canada, Mexico, Rest of North America)
- Europe (France, The UK, Spain, Germany, Italy, Nordic Countries (Denmark, Finland, Iceland, Sweden, Norway), Benelux Union (Belgium, The Netherlands, Luxembourg), Rest of Europe)
- Asia Pacific (China, Japan, India, New Zealand, Australia, South Korea, Southeast Asia (Indonesia, Thailand, Malaysia, Singapore, Rest of Southeast Asia), Rest of Asia Pacific)
- Middle East & Africa (Saudi Arabia, UAE, Egypt, Kuwait, South Africa, Rest of Middle East & Africa)
- Latin America (Brazil, Argentina, Rest of Latin America)
Report Coverage

Table of Contents
**Exclusive for Multi-User and Enterprise User.
Global Carbon Capture and Sequestration Market Scope
By Type
- Capture
- Pre Combustion Capture
- Post Combustion Capture
- Oxyfuel Combustion Capture
- Transportation
- Storage
By Industry
- Chemicals
- Oil & Gas
- Biofuels
- Iron and Steel
- Power Generation
- Cement
- Waste Management and Waste-to-Energy
- Others
By Region
- North America (U.S., Canada, Mexico, Rest of North America)
- Europe (France, The UK, Spain, Germany, Italy, Nordic Countries (Denmark, Finland, Iceland, Sweden, Norway), Benelux Union (Belgium, The Netherlands, Luxembourg), Rest of Europe)
- Asia Pacific (China, Japan, India, New Zealand, Australia, South Korea, Southeast Asia (Indonesia, Thailand, Malaysia, Singapore, Rest of Southeast Asia), Rest of Asia Pacific)
- Middle East & Africa (Saudi Arabia, UAE, Egypt, Kuwait, South Africa, Rest of Middle East & Africa)
- Latin America (Brazil, Argentina, Rest of Latin America)
The Niche Research approach encompasses both primary and secondary research methods to provide comprehensive insights. While primary research is the cornerstone of our studies, we also incorporate secondary research sources such as company annual reports, premium industry databases, press releases, industry journals, and white papers.
Within our primary research, we actively engage with various industry stakeholders, conducting paid interviews and surveys. Our meticulous analysis extends to every market participant in major countries, allowing us to thoroughly examine their portfolios, calculate market shares, and segment revenues.
Our data collection primarily focuses on individual countries within our research scope, enabling us to estimate regional market sizes. Typically, we employ a bottom-up approach, meticulously tracking trends in different countries. We analyze growth drivers, constraints, technological innovations, and opportunities for each country, ultimately arriving at regional figures.Our process begins by examining the growth prospects of each country. Building upon these insights, we project growth and trends for the entire region. Finally, we utilize our proprietary model to refine estimations and forecasts.
Our data validation standards are integral to ensuring the reliability and accuracy of our research findings. Here’s a breakdown of our data validation processes and the stakeholders we engage with during our primary research:
- Supply Side Analysis: We initiate a supply side analysis by directly contacting market participants, through telephonic interviews and questionnaires containing both open-ended and close-ended questions. We gather information on their portfolios, segment revenues, developments, and growth strategies.
- Demand Side Analysis: To gain insights into adoption trends and consumer preferences, we reach out to target customers and users (non-vendors). This information forms a vital part of the qualitative analysis section of our reports, covering market dynamics, adoption trends, consumer behavior, spending patterns, and other related aspects.
- Consultant Insights: We tap into the expertise of our partner consultants from around the world to obtain their unique viewpoints and perspectives. Their insights contribute to a well-rounded understanding of the markets under investigation.
- In-House Validation: To ensure data accuracy and reliability, we conduct cross-validation of data points and information through our in-house team of consultants and utilize advanced data modeling tools for thorough verification.
The forecasts we provide are based on a comprehensive assessment of various factors, including:
- Market Trends and Past Performance (Last Five Years): We accurately analyze market trends and performance data from preceding five years to identify historical patterns and understand the market’s evolution.
- Historical Performance and Growth of Market Participants: We assess the historical performance and growth trajectories of key market participants. This analysis provides insights into the competitive landscape and individual company strategies.
- Market Determinants Impact Analysis (Next Eight Years): We conduct a rigorous analysis of the factors that are projected to influence the market over the next eight years. This includes assessing both internal and external determinants that can shape market dynamics.
- Drivers and Challenges for the Forecast Period:Identify the factors expected to drive market growth during the forecast period, as well as the challenges that the industry may face. This analysis aids in deriving an accurate growth rate projection.
- New Acquisitions, Collaborations, or Partnerships: We keep a close watch on any new acquisitions, collaborations, or partnerships within the industry. These developments can have a significant impact on market dynamics and competitiveness.
- Macro and Micro Factors Analysis:A thorough examination of both macro-level factors (e.g., economic trends, regulatory changes) and micro-level factors (e.g., technological advancements, consumer preferences) that may influence the market during the forecast period.
- End-User Sentiment Analysis: To understand the market from the end-user perspective, we conduct sentiment analysis. This involves assessing the sentiment, preferences, and feedback of the end-users, which can provide valuable insights into market trends.
- Perspective of Primary Participants: Insights gathered directly from primary research participants play a crucial role in shaping our forecasts. Their perspectives and experiences provide valuable qualitative data.
- Year-on-Year Growth Trend: We utilize a year-on-year growth trend based on historical market growth and expected future trends. This helps in formulating our growth projections, aligning them with the market’s historical performance.
Research process adopted by TNR involves multiple stages, including data collection, validation, quality checks, and presentation. It’s crucial that the data and information we provide add value to your existing market understanding and expertise. We have also established partnerships with business consulting, research, and survey organizations across regions and globally to collaborate on regional analysis and data validation, ensuring the highest level of accuracy and reliability in our reports.