Global Marine Fuel Injection System Market: By Component Type, By Engine Type, By Power Rating, By Application, By Region & Segmental Insights Trends and Forecast, 2024 – 2034

  • Industry: Technology
  • Report ID: TNR-110-1085
  • Number of Pages: 420
  • Table/Charts : Yes
  • May, 2024
  • Base Year : 2024
  • No. of Companies : 10+
  • No. of Countries : 29
  • Views : 10079
  • Covid Impact Covered: Yes
  • War Impact Covered: Yes
  • Formats : PDF, Excel, PPT

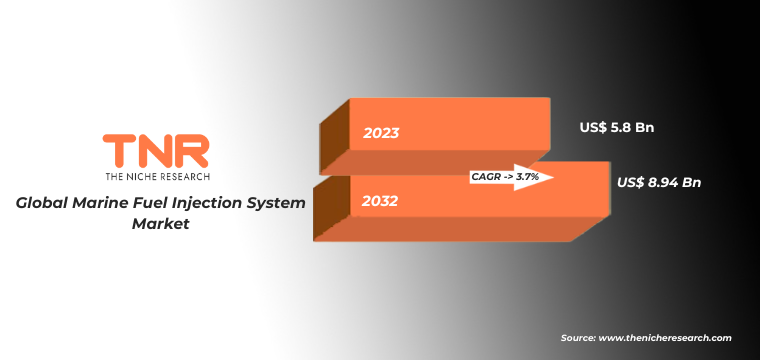
A marine fuel injection system is a critical component of a marine engine responsible for delivering fuel into the combustion chambers with precision timing and metering. It ensures efficient combustion, optimal engine performance, and reduced emissions. The fuel injector is responsible for spraying fuel directly into the combustion chamber or intake port of the engine. It atomizes the fuel into fine droplets for efficient combustion and is controlled by the engine’s electronic control unit (ECU) to precisely regulate fuel delivery according to engine load and speed. The fuel pump delivers pressurized fuel from the fuel tank to the injectors at the required pressure. It may be a mechanical pump driven by the engine’s camshaft or an electric pump controlled by the ECU. The pump maintains fuel pressure within the system to ensure consistent fuel delivery under varying operating conditions. The fuel control unit, also known as the electronic control unit (ECU) or engine control module (ECM), is the brain of the fuel injection system. It receives input signals from various sensors such as throttle position, engine speed, and intake air temperature to calculate the optimal fuel delivery for the current operating conditions. The FCU controls the fuel injectors’ timing, duration, and pulse width to achieve efficient combustion and engine performance. In terms of revenue, the global marine fuel injection system market was worth US$ 5.8 Bn in 2023, anticipated to witness CAGR of 3.7% During 2024 – 2034.

Global Marine Fuel Injection System Market Dynamics

  • Rising Demand for Fuel-Efficient Marine Engines: Increasing environmental concerns and stringent emissions regulations drive the demand for fuel-efficient marine engines. Marine fuel injection systems play a crucial role in optimizing fuel combustion and engine performance, thereby reducing fuel consumption and emissions. As a result, there is a growing market demand for advanced fuel injection systems capable of delivering higher efficiency and lower emissions in marine vessels.
  • Technological Advancements in Fuel Injection Systems: Ongoing technological advancements in fuel injection systems enhance their performance, efficiency, and reliability. Manufacturers are developing innovative fuel injection technologies such as common rail injection, electronic unit injection (EUI), and high-pressure direct injection (HPDI) to meet the evolving needs of the marine industry. These advanced systems offer benefits such as higher injection pressures, finer fuel atomization, improved combustion control, and enhanced fuel economy, driving marine fuel injection system market growth.
  • Growing Shipbuilding Activities: The global maritime industry is witnessing significant growth in shipbuilding activities, driven by increasing trade volumes, infrastructure development, and offshore exploration and production activities. Shipbuilders are integrating advanced propulsion systems and fuel-efficient technologies into new vessel designs to meet customer demands for environmentally friendly and cost-effective solutions. Marine fuel injection systems are integral components of modern marine engines, contributing to the overall efficiency and performance of newly built vessels.

Fuel Injector segment had the Highest Share in the Global Marine Fuel Injection System Market During the Forecast Period (2024 – 2034). 

Fuel injectors are instrumental in enhancing the efficiency of marine engines by precisely delivering fuel into the combustion chamber in atomized form. This optimized fuel delivery ensures efficient combustion, leading to improved fuel economy and reduced emissions. As environmental regulations become more stringent and ship operators seek to minimize operational costs, there is a growing demand for fuel injectors that can deliver higher efficiency and performance. The maritime industry is under pressure to reduce emissions to comply with regulatory standards such as the International Maritime Organization’s (IMO) MARPOL Annex VI. Fuel injectors play a crucial role in emissions reduction by promoting cleaner combustion and minimizing the release of harmful pollutants such as sulfur oxides (SOx), nitrogen oxides (NOx), and particulate matter. As shipowners seek to meet emissions targets and mitigate environmental impact, there is an increasing need for fuel injectors that can contribute to emissions reduction efforts. The growing interest in liquefied natural gas (LNG) as a marine fuel is driving demand for fuel injectors capable of handling alternative fuels. LNG-powered vessels require specialized fuel injection systems to deliver LNG safely and efficiently into the engine’s combustion chamber. Fuel injectors designed for LNG applications must withstand the unique challenges associated with handling cryogenic temperatures and high-pressure fuel delivery, driving innovation and growth of this segment in the marine fuel injection system market.

2 Stroke Engine Segment had the Highest Share in the Global Marine Fuel Injection System Market in 2023.

Marine vessels with 2-stroke engines require fuel injection systems that can deliver precise fuel metering and injection timing to optimize engine performance. Fuel injectors play a crucial role in ensuring efficient combustion by delivering the right amount of fuel at the right time, leading to improved fuel economy, power output, and overall engine efficiency. Shipowners seek fuel injection systems that can enhance the performance of 2-stroke engines, resulting in increased demand for advanced fuel injection technologies. Fuel injection systems for 2-stroke engines need to accommodate a wide range of fuel types and qualities, including heavy fuel oil (HFO), marine diesel oil (MDO), and low-sulfur marine fuels. As the maritime industry shifts towards cleaner fuels such as liquefied natural gas (LNG) and biofuels, there is a growing need for fuel injection systems that can handle alternative fuels effectively. Fuel injectors designed for 2-stroke engines must be capable of delivering consistent performance across different fuel compositions and viscosities, driving demand for flexible and adaptable fuel injection technologies.

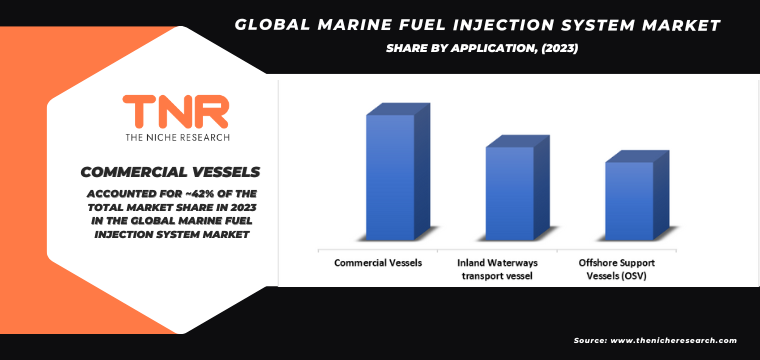
By Application Commercial Vehicle Segment had the Highest Share in the Global Marine Fuel Injection System Market in 2023.

Commercial marine vehicles, including cargo ships, ferries, and tugboats, require fuel-efficient propulsion systems to reduce operational costs and comply with environmental regulations. Marine fuel injection systems play a crucial role in optimizing fuel combustion and engine performance, leading to improved fuel efficiency and reduced fuel consumption. Ship operators seek fuel injection systems that can deliver high efficiency and reliability to minimize fuel expenses and enhance profitability. Commercial marine vehicles operate in demanding conditions, including varying sea states, heavy loads, and long voyages. Fuel injection systems must be robust, reliable, and capable of delivering consistent performance under challenging operating conditions. Shipowners prioritize fuel injection systems that offer durability, resilience, and ease of maintenance to ensure uninterrupted operation and minimize downtime, thereby maximizing vessel productivity and profitability.

The Asia-Pacific region is a major hub for maritime trade, with bustling ports and shipping lanes facilitating the movement of goods and commodities between countries. The increasing demand for marine transportation to support international trade drives the need for efficient and reliable propulsion systems in commercial vessels. Marine fuel injection systems play a critical role in optimizing engine performance and fuel efficiency, meeting the demands of the growing shipping industry in the Asia-Pacific region. The Asia-Pacific region is experiencing rapid growth in offshore energy exploration and production activities, including oil and gas extraction, offshore wind farms, and marine renewable energy projects. Offshore support vessels, drilling rigs, and service boats operating in offshore environments require reliable and efficient propulsion systems to navigate challenging sea conditions and transport personnel and equipment. These systems offer high performance, durability, and fuel efficiency are in demand to support the expansion of offshore energy activities in the region, thus enabling demand of the marine fuel injection system market.

Competitive Landscape: Global Marine Fuel Injection System Market:

  • Caterpillar Inc.
  • Delphi Automotive Plc
  • DENSO Corporation
  • Heinzmann GmbH & Co. KG
  • Liebherr International AG
  • MAN SE
  • Marren Fuel Injection
  • OMT – Officine Meccaniche Torino SpA
  • Robert Bosch GmbH
  • Rolls-Royce Power Systems AG
  • Suzuki Motor Corporation
  • Walbro LLC
  • Yanmar Co. Ltd
  • Other Industry Participants

Global Marine Fuel Injection System Market Scope

Report Specifications Details
Market Revenue in 2023 US$ 5.8 Bn
Market Size Forecast by 2034 US$ 8.94 Bn
Growth Rate (CAGR) 3.7%
Historic Data 2016 – 2022
Base Year for Estimation 2023
Forecast Period 2024 – 2034
Report Inclusions Market Size & Estimates, Market Dynamics, Competitive Scenario, Trends, Growth Factors, Market Determinants, Key Investment Segmentation, Product/Service/Solutions Benchmarking
Segments Covered By Component Type, By Engine Type, By Power Rating, By Application
Regions Covered North America, Europe, Asia Pacific, Middle East & Africa, Latin America
Countries Covered U.S., Canada, Mexico, Rest of North America,  France, The UK, Spain, Germany, Italy, Nordic Countries (Denmark, Finland, Iceland, Sweden, Norway), Benelux Union (Belgium, The Netherlands, Luxembourg), Rest of Europe,  China, Japan, India, New Zealand, Australia, South Korea, Southeast Asia (Indonesia, Thailand, Malaysia, Singapore, Rest of Southeast Asia), Rest of Asia Pacific,  Saudi Arabia, UAE, Egypt, Kuwait, South Africa, Rest of Middle East & Africa,  Brazil, Argentina, Rest of Latin America
Key Players Caterpillar Inc.,Delphi Automotive Plc,DENSO Corporation,Heinzmann GmbH & Co. KG,Liebherr International AG,MAN SE,Marren Fuel Injection,OMT – Officine Meccaniche Torino SpA,Robert Bosch GmbH,Rolls-Royce Power Systems AG,Suzuki Motor Corporation,Walbro LLC,Yanmar Co. Ltd, Other Industry Participants
Customization Scope Customization allows for the inclusion/modification of content pertaining to geographical regions, countries, and specific market segments.
Pricing & Procurement Options Explore purchase options tailored to your specific research requirements
Contact Details Consult With Our Expert

Japan (Toll-Free):  +81 663-386-8111

South Korea (Toll-Free):  +82-808- 703-126

Saudi Arabia (Toll-Free):  +966 800-850-1643

United Kingdom: +44 753-710-5080

United States: +1 302-232-5106

E-mail:  askanexpert@thenicheresearch.com 

Global Marine Fuel Injection System Market

By Component Type

  • Fuel Injector
  • Fuel Pump
  • Fuel Valve
  • Electronic Control Unit (ECU)
  • Others

By Engine Type

  • 2-Stroke
  • 4-Stroke

By Power Rating

  • 0 HP–2,000 HP
  • 2,001 HP–10,000 HP
  • 10,001 HP–20,000 HP
  • 20,001 HP–50,000 HP
  • 50,000 HP- 80,000 HP
  • Above 80,001 HP

By Application

  • Commercial Vessels
    • Passenger Cruise
    • Bulk Carrier & Container Ships
    • Tankers
    • Others
  • Inland Waterways transport vessel
  • Offshore Support Vessels (OSV)

By Region

  • North America (U.S., Canada, Mexico, Rest of North America)
  • Europe (France, The UK, Spain, Germany, Italy, Nordic Countries (Denmark, Finland, Iceland, Sweden, Norway), Benelux Union (Belgium, The Netherlands, Luxembourg), Rest of Europe)
  • Asia Pacific (China, Japan, India, New Zealand, Australia, South Korea, Southeast Asia (Indonesia, Thailand, Malaysia, Singapore, Rest of Southeast Asia), Rest of Asia Pacific)
  • Middle East & Africa (Saudi Arabia, UAE, Egypt, Kuwait, South Africa, Rest of Middle East & Africa)
  • Latin America (Brazil, Argentina, Rest of Latin America)

 Report Layout


Table of Contents

.

1.Market Scope
1.1.Market Segmentation

1.2.Years Considered
1.2.1.Historic Years: 2016 – 2022

1.2.2.Base Year: 2023

1.2.3.Forecast Years: 2024 – 2034

2.Key Target Audiences

3.Research Methodology
3.1.Primary Research
3.1.1.Research Questionnaire

3.1.2.Global Percentage Breakdown

3.1.3.Primary Interviews: Key Opinion Leaders (KOLs)

3.2.Secondary Research
3.2.1.Paid Databases

3.2.2.Secondary Sources

3.3.Market Size Estimates
3.3.1.Top-Down Approach

3.3.2.Bottom-Up Approach

3.4.Data Triangulation Methodology

3.5.Research Assumptions

4.Recommendations and Insights from TNR’s Perspective**

5.Holistic Overview of Marine Fuel Injection System Market

6.Market Synopsis: Marine Fuel Injection System Market

7.Marine Fuel Injection System Market Analysis: Qualitative Perspective
7.1.Introduction
7.1.1.Product Definition

7.1.2.Industry Development

7.2.Market Dynamics
7.2.1.Drivers

7.2.2.Restraints

7.2.3.Opportunities

7.2.4.Challenges

7.3.Trends in Marine Fuel Injection System Market

7.4.Market Determinants Radar Chart

7.5.Macro-Economic and Micro-Economic Indicators: Marine Fuel Injection System Market

7.6.Porter’s Five Force Analysis

7.7.Impact of Covid-19 on Marine Fuel Injection System Market

7.8.PESTEL Analysis

8.Global Marine Fuel Injection System Market Analysis and Forecasts, 2024 – 2034
8.1.Overview
8.1.1.Global Marine Fuel Injection System Market Revenue (US$ Mn)

8.2.Global Marine Fuel Injection System Market Revenue (US$ Mn) and Forecasts, By Component Type
8.2.1.Fuel Injector
8.2.1.1.Definition

8.2.1.2.Market Estimation and Penetration, 2016 – 2023

8.2.1.3.Market Forecast, 2024 – 2034

8.2.1.4.Compound Annual Growth Rate (CAGR)

8.2.1.5.Regional Bifurcation
8.2.1.5.1.North America
8.2.1.5.1.1.Market Estimation, 2016 – 2023

8.2.1.5.1.2.Market Forecast, 2024 – 2034

8.2.1.5.2.Europe
8.2.1.5.2.1.Market Estimation, 2016 – 2023

8.2.1.5.2.2.Market Forecast, 2024 – 2034

8.2.1.5.3.Asia Pacific
8.2.1.5.3.1.Market Estimation, 2016 – 2023

8.2.1.5.3.2.Market Forecast, 2024 – 2034

8.2.1.5.4.Middle East and Africa
8.2.1.5.4.1.Market Estimation, 2016 – 2023

8.2.1.5.4.2.Market Forecast, 2024 – 2034

8.2.1.5.5.Latin America
8.2.1.5.5.1.Market Estimation, 2016 – 2023

8.2.1.5.5.2.Market Forecast, 2024 – 2034

8.2.2.Fuel Pump
8.2.2.1.Definition

8.2.2.2.Market Estimation and Penetration, 2016 – 2023

8.2.2.3.Market Forecast, 2024 – 2034

8.2.2.4.Compound Annual Growth Rate (CAGR)

8.2.2.5.Regional Bifurcation
8.2.2.5.1.North America
8.2.2.5.1.1.Market Estimation, 2016 – 2023

8.2.2.5.1.2.Market Forecast, 2024 – 2034

8.2.2.5.2.Europe
8.2.2.5.2.1.Market Estimation, 2016 – 2023

8.2.2.5.2.2.Market Forecast, 2024 – 2034

8.2.2.5.3.Asia Pacific
8.2.2.5.3.1.Market Estimation, 2016 – 2023

8.2.2.5.3.2.Market Forecast, 2024 – 2034

8.2.2.5.4.Middle East and Africa
8.2.2.5.4.1.Market Estimation, 2016 – 2023

8.2.2.5.4.2.Market Forecast, 2024 – 2034

8.2.2.5.5.Latin America
8.2.2.5.5.1.Market Estimation, 2016 – 2023

8.2.2.5.5.2.Market Forecast, 2024 – 2034

8.2.3.Fuel Valve
8.2.3.1.Definition

8.2.3.2.Market Estimation and Penetration, 2016 – 2023

8.2.3.3.Market Forecast, 2024 – 2034

8.2.3.4.Compound Annual Growth Rate (CAGR)

8.2.3.5.Regional Bifurcation
8.2.3.5.1.North America
8.2.3.5.1.1.Market Estimation, 2016 – 2023

8.2.3.5.1.2.Market Forecast, 2024 – 2034

8.2.3.5.2.Europe
8.2.3.5.2.1.Market Estimation, 2016 – 2023

8.2.3.5.2.2.Market Forecast, 2024 – 2034

8.2.3.5.3.Asia Pacific
8.2.3.5.3.1.Market Estimation, 2016 – 2023

8.2.3.5.3.2.Market Forecast, 2024 – 2034

8.2.3.5.4.Middle East and Africa
8.2.3.5.4.1.Market Estimation, 2016 – 2023

8.2.3.5.4.2.Market Forecast, 2024 – 2034

8.2.3.5.5.Latin America
8.2.3.5.5.1.Market Estimation, 2016 – 2023

8.2.3.5.5.2.Market Forecast, 2024 – 2034

8.2.4.Electronic Control Unit (ECU)
8.2.4.1.Definition

8.2.4.2.Market Estimation and Penetration, 2016 – 2023

8.2.4.3.Market Forecast, 2024 – 2034

8.2.4.4.Compound Annual Growth Rate (CAGR)

8.2.4.5.Regional Bifurcation
8.2.4.5.1.North America
8.2.4.5.1.1.Market Estimation, 2016 – 2023

8.2.4.5.1.2.Market Forecast, 2024 – 2034

8.2.4.5.2.Europe
8.2.4.5.2.1.Market Estimation, 2016 – 2023

8.2.4.5.2.2.Market Forecast, 2024 – 2034

8.2.4.5.3.Asia Pacific
8.2.4.5.3.1.Market Estimation, 2016 – 2023

8.2.4.5.3.2.Market Forecast, 2024 – 2034

8.2.4.5.4.Middle East and Africa
8.2.4.5.4.1.Market Estimation, 2016 – 2023

8.2.4.5.4.2.Market Forecast, 2024 – 2034

8.2.4.5.5.Latin America
8.2.4.5.5.1.Market Estimation, 2016 – 2023

8.2.4.5.5.2.Market Forecast, 2024 – 2034

8.2.5.Others
8.2.5.1.Definition

8.2.5.2.Market Estimation and Penetration, 2016 – 2023

8.2.5.3.Market Forecast, 2024 – 2034

8.2.5.4.Compound Annual Growth Rate (CAGR)

8.2.5.5.Regional Bifurcation
8.2.5.5.1.North America
8.2.5.5.1.1.Market Estimation, 2016 – 2023

8.2.5.5.1.2.Market Forecast, 2024 – 2034

8.2.5.5.2.Europe
8.2.5.5.2.1.Market Estimation, 2016 – 2023

8.2.5.5.2.2.Market Forecast, 2024 – 2034

8.2.5.5.3.Asia Pacific
8.2.5.5.3.1.Market Estimation, 2016 – 2023

8.2.5.5.3.2.Market Forecast, 2024 – 2034

8.2.5.5.4.Middle East and Africa
8.2.5.5.4.1.Market Estimation, 2016 – 2023

8.2.5.5.4.2.Market Forecast, 2024 – 2034

8.2.5.5.5.Latin America
8.2.5.5.5.1.Market Estimation, 2016 – 2023

8.2.5.5.5.2.Market Forecast, 2024 – 2034

8.3.Key Segment for Channeling Investments
8.3.1.By Component Type

9.Global Marine Fuel Injection System Market Analysis and Forecasts, 2024 – 2034
9.1.Overview

9.2.Global Marine Fuel Injection System Market Revenue (US$ Mn) and Forecasts, By Engine Type
9.2.1.2-Stroke
9.2.1.1.Definition

9.2.1.2.Market Estimation and Penetration, 2016 – 2023

9.2.1.3.Market Forecast, 2024 – 2034

9.2.1.4.Compound Annual Growth Rate (CAGR)

9.2.1.5.Regional Bifurcation
9.2.1.5.1.North America
9.2.1.5.1.1.Market Estimation, 2016 – 2023

9.2.1.5.1.2.Market Forecast, 2024 – 2034

9.2.1.5.2.Europe
9.2.1.5.2.1.Market Estimation, 2016 – 2023

9.2.1.5.2.2.Market Forecast, 2024 – 2034

9.2.1.5.3.Asia Pacific
9.2.1.5.3.1.Market Estimation, 2016 – 2023

9.2.1.5.3.2.Market Forecast, 2024 – 2034

9.2.1.5.4.Middle East and Africa
9.2.1.5.4.1.Market Estimation, 2016 – 2023

9.2.1.5.4.2.Market Forecast, 2024 – 2034

9.2.1.5.5.Latin America
9.2.1.5.5.1.Market Estimation, 2016 – 2023

9.2.1.5.5.2.Market Forecast, 2024 – 2034

9.2.2.4-Stroke
9.2.2.1.Definition

9.2.2.2.Market Estimation and Penetration, 2016 – 2023

9.2.2.3.Market Forecast, 2024 – 2034

9.2.2.4.Compound Annual Growth Rate (CAGR)

9.2.2.5.Regional Bifurcation
9.2.2.5.1.North America
9.2.2.5.1.1.Market Estimation, 2016 – 2023

9.2.2.5.1.2.Market Forecast, 2024 – 2034

9.2.2.5.2.Europe
9.2.2.5.2.1.Market Estimation, 2016 – 2023

9.2.2.5.2.2.Market Forecast, 2024 – 2034

9.2.2.5.3.Asia Pacific
9.2.2.5.3.1.Market Estimation, 2016 – 2023

9.2.2.5.3.2.Market Forecast, 2024 – 2034

9.2.2.5.4.Middle East and Africa
9.2.2.5.4.1.Market Estimation, 2016 – 2023

9.2.2.5.4.2.Market Forecast, 2024 – 2034

9.2.2.5.5.Latin America
9.2.2.5.5.1.Market Estimation, 2016 – 2023

9.2.2.5.5.2.Market Forecast, 2024 – 2034

9.3.Key Segment for Channeling Investments
9.3.1.By Engine Type

10.Global Marine Fuel Injection System Market Analysis and Forecasts, 2024 – 2034
10.1.Overview

10.2.Global Marine Fuel Injection System Market Revenue (US$ Mn) and Forecasts, By Power Rating
10.2.1.0 HP–2,000 HP
10.2.1.1.Definition

10.2.1.2.Market Estimation and Penetration, 2016 – 2023

10.2.1.3.Market Forecast, 2024 – 2034

10.2.1.4.Compound Annual Growth Rate (CAGR)

10.2.1.5.Regional Bifurcation
10.2.1.5.1.North America
10.2.1.5.1.1.Market Estimation, 2016 – 2023

10.2.1.5.1.2.Market Forecast, 2024 – 2034

10.2.1.5.2.Europe
10.2.1.5.2.1.Market Estimation, 2016 – 2023

10.2.1.5.2.2.Market Forecast, 2024 – 2034

10.2.1.5.3.Asia Pacific
10.2.1.5.3.1.Market Estimation, 2016 – 2023

10.2.1.5.3.2.Market Forecast, 2024 – 2034

10.2.1.5.4.Middle East and Africa
10.2.1.5.4.1.Market Estimation, 2016 – 2023

10.2.1.5.4.2.Market Forecast, 2024 – 2034

10.2.1.5.5.Latin America
10.2.1.5.5.1.Market Estimation, 2016 – 2023

10.2.1.5.5.2.Market Forecast, 2024 – 2034

10.2.2.2,001 HP–10,000 HP
10.2.2.1.Definition

10.2.2.2.Market Estimation and Penetration, 2016 – 2023

10.2.2.3.Market Forecast, 2024 – 2034

10.2.2.4.Compound Annual Growth Rate (CAGR)

10.2.2.5.Regional Bifurcation
10.2.2.5.1.North America
10.2.2.5.1.1.Market Estimation, 2016 – 2023

10.2.2.5.1.2.Market Forecast, 2024 – 2034

10.2.2.5.2.Europe
10.2.2.5.2.1.Market Estimation, 2016 – 2023

10.2.2.5.2.2.Market Forecast, 2024 – 2034

10.2.2.5.3.Asia Pacific
10.2.2.5.3.1.Market Estimation, 2016 – 2023

10.2.2.5.3.2.Market Forecast, 2024 – 2034

10.2.2.5.4.Middle East and Africa
10.2.2.5.4.1.Market Estimation, 2016 – 2023

10.2.2.5.4.2.Market Forecast, 2024 – 2034

10.2.2.5.5.Latin America
10.2.2.5.5.1.Market Estimation, 2016 – 2023

10.2.2.5.5.2.Market Forecast, 2024 – 2034

10.2.3.10,001 HP–20,000 HP
10.2.3.1.Definition

10.2.3.2.Market Estimation and Penetration, 2016 – 2023

10.2.3.3.Market Forecast, 2024 – 2034

10.2.3.4.Compound Annual Growth Rate (CAGR)

10.2.3.5.Regional Bifurcation
10.2.3.5.1.North America
10.2.3.5.1.1.Market Estimation, 2016 – 2023

10.2.3.5.1.2.Market Forecast, 2024 – 2034

10.2.3.5.2.Europe
10.2.3.5.2.1.Market Estimation, 2016 – 2023

10.2.3.5.2.2.Market Forecast, 2024 – 2034

10.2.3.5.3.Asia Pacific
10.2.3.5.3.1.Market Estimation, 2016 – 2023

10.2.3.5.3.2.Market Forecast, 2024 – 2034

10.2.3.5.4.Middle East and Africa
10.2.3.5.4.1.Market Estimation, 2016 – 2023

10.2.3.5.4.2.Market Forecast, 2024 – 2034

10.2.3.5.5.Latin America
10.2.3.5.5.1.Market Estimation, 2016 – 2023

10.2.3.5.5.2.Market Forecast, 2024 – 2034

10.2.4.20,001 HP–50,000 HP
10.2.4.1.Definition

10.2.4.2.Market Estimation and Penetration, 2016 – 2023

10.2.4.3.Market Forecast, 2024 – 2034

10.2.4.4.Compound Annual Growth Rate (CAGR)

10.2.4.5.Regional Bifurcation
10.2.4.5.1.North America
10.2.4.5.1.1.Market Estimation, 2016 – 2023

10.2.4.5.1.2.Market Forecast, 2024 – 2034

10.2.4.5.2.Europe
10.2.4.5.2.1.Market Estimation, 2016 – 2023

10.2.4.5.2.2.Market Forecast, 2024 – 2034

10.2.4.5.3.Asia Pacific
10.2.4.5.3.1.Market Estimation, 2016 – 2023

10.2.4.5.3.2.Market Forecast, 2024 – 2034

10.2.4.5.4.Middle East and Africa
10.2.4.5.4.1.Market Estimation, 2016 – 2023

10.2.4.5.4.2.Market Forecast, 2024 – 2034

10.2.4.5.5.Latin America
10.2.4.5.5.1.Market Estimation, 2016 – 2023

10.2.4.5.5.2.Market Forecast, 2024 – 2034

10.2.5.50,000 HP- 80,000 HP
10.2.5.1.Definition

10.2.5.2.Market Estimation and Penetration, 2016 – 2023

10.2.5.3.Market Forecast, 2024 – 2034

10.2.5.4.Compound Annual Growth Rate (CAGR)

10.2.5.5.Regional Bifurcation
10.2.5.5.1.North America
10.2.5.5.1.1.Market Estimation, 2016 – 2023

10.2.5.5.1.2.Market Forecast, 2024 – 2034

10.2.5.5.2.Europe
10.2.5.5.2.1.Market Estimation, 2016 – 2023

10.2.5.5.2.2.Market Forecast, 2024 – 2034

10.2.5.5.3.Asia Pacific
10.2.5.5.3.1.Market Estimation, 2016 – 2023

10.2.5.5.3.2.Market Forecast, 2024 – 2034

10.2.5.5.4.Middle East and Africa
10.2.5.5.4.1.Market Estimation, 2016 – 2023

10.2.5.5.4.2.Market Forecast, 2024 – 2034

10.2.5.5.5.Latin America
10.2.5.5.5.1.Market Estimation, 2016 – 2023

10.2.5.5.5.2.Market Forecast, 2024 – 2034

10.2.6.Above 80,001 HP
10.2.6.1.Definition

10.2.6.2.Market Estimation and Penetration, 2016 – 2023

10.2.6.3.Market Forecast, 2024 – 2034

10.2.6.4.Compound Annual Growth Rate (CAGR)

10.2.6.5.Regional Bifurcation
10.2.6.5.1.North America
10.2.6.5.1.1.Market Estimation, 2016 – 2023

10.2.6.5.1.2.Market Forecast, 2024 – 2034

10.2.6.5.2.Europe
10.2.6.5.2.1.Market Estimation, 2016 – 2023

10.2.6.5.2.2.Market Forecast, 2024 – 2034

10.2.6.5.3.Asia Pacific
10.2.6.5.3.1.Market Estimation, 2016 – 2023

10.2.6.5.3.2.Market Forecast, 2024 – 2034

10.2.6.5.4.Middle East and Africa
10.2.6.5.4.1.Market Estimation, 2016 – 2023

10.2.6.5.4.2.Market Forecast, 2024 – 2034

10.2.6.5.5.Latin America
10.2.6.5.5.1.Market Estimation, 2016 – 2023

10.2.6.5.5.2.Market Forecast, 2024 – 2034

10.3.Key Segment for Channeling Investments
10.3.1.By Power Rating

11.Global Marine Fuel Injection System Market Analysis and Forecasts, 2024 – 2034
11.1.Overview

11.2.Global Marine Fuel Injection System Market Revenue (US$ Mn) and Forecasts, By Application
11.2.1.Commercial Vessels (Definition, Market Estimation and Penetration, 2016 – 2023, Market Estimation (2016 – 2023), Market Forecast (2024 – 2034), Compound Annual Growth Rate (CAGR), Regional Bifurcation (North America, Europe, Asia Pacific, Middle East and Africa, Latin America) and Information on Passenger Cruise, Bulk Carrier and Container Ships, Tankers, Others)
11.2.1.1.Passenger Cruise

11.2.1.2.Bulk Carrier and Container Ships

11.2.1.3.Tankers

11.2.1.4.Others

11.2.2.Inland Waterways transport vessel
11.2.2.1.Definition

11.2.2.2.Market Estimation and Penetration, 2016 – 2023

11.2.2.3.Market Forecast, 2024 – 2034

11.2.2.4.Compound Annual Growth Rate (CAGR)

11.2.2.5.Regional Bifurcation
11.2.2.5.1.North America
11.2.2.5.1.1.Market Estimation, 2016 – 2023

11.2.2.5.1.2.Market Forecast, 2024 – 2034

11.2.2.5.2.Europe
11.2.2.5.2.1.Market Estimation, 2016 – 2023

11.2.2.5.2.2.Market Forecast, 2024 – 2034

11.2.2.5.3.Asia Pacific
11.2.2.5.3.1.Market Estimation, 2016 – 2023

11.2.2.5.3.2.Market Forecast, 2024 – 2034

11.2.2.5.4.Middle East and Africa
11.2.2.5.4.1.Market Estimation, 2016 – 2023

11.2.2.5.4.2.Market Forecast, 2024 – 2034

11.2.2.5.5.Latin America
11.2.2.5.5.1.Market Estimation, 2016 – 2023

11.2.2.5.5.2.Market Forecast, 2024 – 2034

11.2.3.Offshore Support Vessels (OSV)
11.2.3.1.Definition

11.2.3.2.Market Estimation and Penetration, 2016 – 2023

11.2.3.3.Market Forecast, 2024 – 2034

11.2.3.4.Compound Annual Growth Rate (CAGR)

11.2.3.5.Regional Bifurcation
11.2.3.5.1.North America
11.2.3.5.1.1.Market Estimation, 2016 – 2023

11.2.3.5.1.2.Market Forecast, 2024 – 2034

11.2.3.5.2.Europe
11.2.3.5.2.1.Market Estimation, 2016 – 2023

11.2.3.5.2.2.Market Forecast, 2024 – 2034

11.2.3.5.3.Asia Pacific
11.2.3.5.3.1.Market Estimation, 2016 – 2023

11.2.3.5.3.2.Market Forecast, 2024 – 2034

11.2.3.5.4.Middle East and Africa
11.2.3.5.4.1.Market Estimation, 2016 – 2023

11.2.3.5.4.2.Market Forecast, 2024 – 2034

11.2.3.5.5.Latin America
11.2.3.5.5.1.Market Estimation, 2016 – 2023

11.2.3.5.5.2.Market Forecast, 2024 – 2034

11.3.Key Segment for Channeling Investments
11.3.1.By Application

12.North America Marine Fuel Injection System Market Analysis and Forecasts, 2024 – 2034
12.1.Overview
12.1.1.North America Marine Fuel Injection System Market Revenue (US$ Mn)

12.2.North America Marine Fuel Injection System Market Revenue (US$ Mn) and Forecasts, By Component Type
12.2.1.Fuel Injector

12.2.2.Fuel Pump

12.2.3.Fuel Valve

12.2.4.Electronic Control Unit (ECU)

12.2.5.Others

12.3.North America Marine Fuel Injection System Market Revenue (US$ Mn) and Forecasts, By Engine Type
12.3.1.2-Stroke

12.3.2.4-Stroke

12.4.North America Marine Fuel Injection System Market Revenue (US$ Mn) and Forecasts, By Power Rating
12.4.1.0 HP–2,000 HP

12.4.2.2,001 HP–10,000 HP

12.4.3.10,001 HP–20,000 HP

12.4.4.20,001 HP–50,000 HP

12.4.5.50,000 HP- 80,000 HP

12.4.6.Above 80,001 HP

12.5.North America Marine Fuel Injection System Market Revenue (US$ Mn) and Forecasts, By Application
12.5.1.Commercial Vessels
12.5.1.1.Passenger Cruise

12.5.1.2.Bulk Carrier and Container Ships

12.5.1.3.Tankers

12.5.1.4.Others

12.5.2.Inland Waterways transport vessel

12.5.3.Offshore Support Vessels (OSV)

12.6.North America Marine Fuel Injection System Market Revenue (US$ Mn) and Forecasts, By Country
12.6.1.U.S
12.6.1.1.U.S Marine Fuel Injection System Market Revenue (US$ Mn) and Forecasts, By Component Type
12.6.1.1.1.Fuel Injector

12.6.1.1.2.Fuel Pump

12.6.1.1.3.Fuel Valve

12.6.1.1.4.Electronic Control Unit (ECU)

12.6.1.1.5.Others

12.6.1.2.U.S Marine Fuel Injection System Market Revenue (US$ Mn) and Forecasts, By Engine Type
12.6.1.2.1.2-Stroke

12.6.1.2.2.4-Stroke

12.6.1.3.U.S Marine Fuel Injection System Market Revenue (US$ Mn) and Forecasts, By Power Rating
12.6.1.3.1.0 HP–2,000 HP

12.6.1.3.2.2,001 HP–10,000 HP

12.6.1.3.3.10,001 HP–20,000 HP

12.6.1.3.4.20,001 HP–50,000 HP

12.6.1.3.5.50,000 HP- 80,000 HP

12.6.1.3.6.Above 80,001 HP

12.6.1.4.U.S Marine Fuel Injection System Market Revenue (US$ Mn) and Forecasts, By Application
12.6.1.4.1.Commercial Vessels
12.6.1.4.1.1.Passenger Cruise

12.6.1.4.1.2.Bulk Carrier and Container Ships

12.6.1.4.1.3.Tankers

12.6.1.4.1.4.Others

12.6.1.4.2.Inland Waterways transport vessel

12.6.1.4.3.Offshore Support Vessels (OSV)

12.6.2.Canada
12.6.2.1.Canada Marine Fuel Injection System Market Revenue (US$ Mn) and Forecasts, By Component Type
12.6.2.1.1.Fuel Injector

12.6.2.1.2.Fuel Pump

12.6.2.1.3.Fuel Valve

12.6.2.1.4.Electronic Control Unit (ECU)

12.6.2.1.5.Others

12.6.2.2.Canada Marine Fuel Injection System Market Revenue (US$ Mn) and Forecasts, By Engine Type
12.6.2.2.1.2-Stroke

12.6.2.2.2.4-Stroke

12.6.2.3.Canada Marine Fuel Injection System Market Revenue (US$ Mn) and Forecasts, By Power Rating
12.6.2.3.1.0 HP–2,000 HP

12.6.2.3.2.2,001 HP–10,000 HP

12.6.2.3.3.10,001 HP–20,000 HP

12.6.2.3.4.20,001 HP–50,000 HP

12.6.2.3.5.50,000 HP- 80,000 HP

12.6.2.3.6.Above 80,001 HP

12.6.2.4.Canada Marine Fuel Injection System Market Revenue (US$ Mn) and Forecasts, By Application
12.6.2.4.1.Commercial Vessels
12.6.2.4.1.1.Passenger Cruise

12.6.2.4.1.2.Bulk Carrier and Container Ships

12.6.2.4.1.3.Tankers

12.6.2.4.1.4.Others

12.6.2.4.2.Inland Waterways transport vessel

12.6.2.4.3.Offshore Support Vessels (OSV)

12.6.3.Mexico
12.6.3.1.Mexico Marine Fuel Injection System Market Revenue (US$ Mn) and Forecasts, By Component Type
12.6.3.1.1.Fuel Injector

12.6.3.1.2.Fuel Pump

12.6.3.1.3.Fuel Valve

12.6.3.1.4.Electronic Control Unit (ECU)

12.6.3.1.5.Others

12.6.3.2.Mexico Marine Fuel Injection System Market Revenue (US$ Mn) and Forecasts, By Engine Type
12.6.3.2.1.2-Stroke

12.6.3.2.2.4-Stroke

12.6.3.3.Mexico Marine Fuel Injection System Market Revenue (US$ Mn) and Forecasts, By Power Rating
12.6.3.3.1.0 HP–2,000 HP

12.6.3.3.2.2,001 HP–10,000 HP

12.6.3.3.3.10,001 HP–20,000 HP

12.6.3.3.4.20,001 HP–50,000 HP

12.6.3.3.5.50,000 HP- 80,000 HP

12.6.3.3.6.Above 80,001 HP

12.6.3.4.Mexico Marine Fuel Injection System Market Revenue (US$ Mn) and Forecasts, By Application
12.6.3.4.1.Commercial Vessels
12.6.3.4.1.1.Passenger Cruise

12.6.3.4.1.2.Bulk Carrier and Container Ships

12.6.3.4.1.3.Tankers

12.6.3.4.1.4.Others

12.6.3.4.2.Inland Waterways transport vessel

12.6.3.4.3.Offshore Support Vessels (OSV)

12.6.4.Rest of North America
12.6.4.1.Rest of North America Marine Fuel Injection System Market Revenue (US$ Mn) and Forecasts, By Component Type
12.6.4.1.1.Fuel Injector

12.6.4.1.2.Fuel Pump

12.6.4.1.3.Fuel Valve

12.6.4.1.4.Electronic Control Unit (ECU)

12.6.4.1.5.Others

12.6.4.2.Rest of North America Marine Fuel Injection System Market Revenue (US$ Mn) and Forecasts, By Engine Type
12.6.4.2.1.2-Stroke

12.6.4.2.2.4-Stroke

12.6.4.3.Rest of North America Marine Fuel Injection System Market Revenue (US$ Mn) and Forecasts, By Power Rating
12.6.4.3.1.0 HP–2,000 HP

12.6.4.3.2.2,001 HP–10,000 HP

12.6.4.3.3.10,001 HP–20,000 HP

12.6.4.3.4.20,001 HP–50,000 HP

12.6.4.3.5.50,000 HP- 80,000 HP

12.6.4.3.6.Above 80,001 HP

12.6.4.4.Rest of North America Marine Fuel Injection System Market Revenue (US$ Mn) and Forecasts, By Application
12.6.4.4.1.Commercial Vessels
12.6.4.4.1.1.Passenger Cruise

12.6.4.4.1.2.Bulk Carrier and Container Ships

12.6.4.4.1.3.Tankers

12.6.4.4.1.4.Others

12.6.4.4.2.Inland Waterways transport vessel

12.6.4.4.3.Offshore Support Vessels (OSV)

12.7.Key Segment for Channeling Investments
12.7.1.By Country

12.7.2.By Component Type

12.7.3.By Engine Type

12.7.4.By Power Rating

12.7.5.By Application

13.Europe Marine Fuel Injection System Market Analysis and Forecasts, 2024 – 2034
13.1.Overview
13.1.1.Europe Marine Fuel Injection System Market Revenue (US$ Mn)

13.2.Europe Marine Fuel Injection System Market Revenue (US$ Mn) and Forecasts, By Component Type
13.2.1.Fuel Injector

13.2.2.Fuel Pump

13.2.3.Fuel Valve

13.2.4.Electronic Control Unit (ECU)

13.2.5.Others

13.3.Europe Marine Fuel Injection System Market Revenue (US$ Mn) and Forecasts, By Engine Type
13.3.1.2-Stroke

13.3.2.4-Stroke

13.4.Europe Marine Fuel Injection System Market Revenue (US$ Mn) and Forecasts, By Power Rating
13.4.1.0 HP–2,000 HP

13.4.2.2,001 HP–10,000 HP

13.4.3.10,001 HP–20,000 HP

13.4.4.20,001 HP–50,000 HP

13.4.5.50,000 HP- 80,000 HP

13.4.6.Above 80,001 HP

13.5.Europe Marine Fuel Injection System Market Revenue (US$ Mn) and Forecasts, By Application
13.5.1.Commercial Vessels
13.5.1.1.Passenger Cruise

13.5.1.2.Bulk Carrier and Container Ships

13.5.1.3.Tankers

13.5.1.4.Others

13.5.2.Inland Waterways transport vessel

13.5.3.Offshore Support Vessels (OSV)

13.6.Europe Marine Fuel Injection System Market Revenue (US$ Mn) and Forecasts, By Country
13.6.1.France
13.6.1.1.France Marine Fuel Injection System Market Revenue (US$ Mn) and Forecasts, By Component Type
13.6.1.1.1.Fuel Injector

13.6.1.1.2.Fuel Pump

13.6.1.1.3.Fuel Valve

13.6.1.1.4.Electronic Control Unit (ECU)

13.6.1.1.5.Others

13.6.1.2.France Marine Fuel Injection System Market Revenue (US$ Mn) and Forecasts, By Engine Type
13.6.1.2.1.2-Stroke

13.6.1.2.2.4-Stroke

13.6.1.3.France Marine Fuel Injection System Market Revenue (US$ Mn) and Forecasts, By Power Rating
13.6.1.3.1.0 HP–2,000 HP

13.6.1.3.2.2,001 HP–10,000 HP

13.6.1.3.3.10,001 HP–20,000 HP

13.6.1.3.4.20,001 HP–50,000 HP

13.6.1.3.5.50,000 HP- 80,000 HP

13.6.1.3.6.Above 80,001 HP

13.6.1.4.France Marine Fuel Injection System Market Revenue (US$ Mn) and Forecasts, By Application
13.6.1.4.1.Commercial Vessels
13.6.1.4.1.1.Passenger Cruise

13.6.1.4.1.2.Bulk Carrier and Container Ships

13.6.1.4.1.3.Tankers

13.6.1.4.1.4.Others

13.6.1.4.2.Inland Waterways transport vessel

13.6.1.4.3.Offshore Support Vessels (OSV)

13.6.2.The UK
13.6.2.1.The UK Marine Fuel Injection System Market Revenue (US$ Mn) and Forecasts, By Component Type
13.6.2.1.1.Fuel Injector

13.6.2.1.2.Fuel Pump

13.6.2.1.3.Fuel Valve

13.6.2.1.4.Electronic Control Unit (ECU)

13.6.2.1.5.Others

13.6.2.2.The UK Marine Fuel Injection System Market Revenue (US$ Mn) and Forecasts, By Engine Type
13.6.2.2.1.2-Stroke

13.6.2.2.2.4-Stroke

13.6.2.3.The UK Marine Fuel Injection System Market Revenue (US$ Mn) and Forecasts, By Power Rating
13.6.2.3.1.0 HP–2,000 HP

13.6.2.3.2.2,001 HP–10,000 HP

13.6.2.3.3.10,001 HP–20,000 HP

13.6.2.3.4.20,001 HP–50,000 HP

13.6.2.3.5.50,000 HP- 80,000 HP

13.6.2.3.6.Above 80,001 HP

13.6.2.4.The UK Marine Fuel Injection System Market Revenue (US$ Mn) and Forecasts, By Application
13.6.2.4.1.Commercial Vessels
13.6.2.4.1.1.Passenger Cruise

13.6.2.4.1.2.Bulk Carrier and Container Ships

13.6.2.4.1.3.Tankers

13.6.2.4.1.4.Others

13.6.2.4.2.Inland Waterways transport vessel

13.6.2.4.3.Offshore Support Vessels (OSV)

13.6.3.Spain
13.6.3.1.Spain Marine Fuel Injection System Market Revenue (US$ Mn) and Forecasts, By Component Type
13.6.3.1.1.Fuel Injector

13.6.3.1.2.Fuel Pump

13.6.3.1.3.Fuel Valve

13.6.3.1.4.Electronic Control Unit (ECU)

13.6.3.1.5.Others

13.6.3.2.Spain Marine Fuel Injection System Market Revenue (US$ Mn) and Forecasts, By Engine Type
13.6.3.2.1.2-Stroke

13.6.3.2.2.4-Stroke

13.6.3.3.Spain Marine Fuel Injection System Market Revenue (US$ Mn) and Forecasts, By Power Rating
13.6.3.3.1.0 HP–2,000 HP

13.6.3.3.2.2,001 HP–10,000 HP

13.6.3.3.3.10,001 HP–20,000 HP

13.6.3.3.4.20,001 HP–50,000 HP

13.6.3.3.5.50,000 HP- 80,000 HP

13.6.3.3.6.Above 80,001 HP

13.6.3.4.Spain Marine Fuel Injection System Market Revenue (US$ Mn) and Forecasts, By Application
13.6.3.4.1.Commercial Vessels
13.6.3.4.1.1.Passenger Cruise

13.6.3.4.1.2.Bulk Carrier and Container Ships

13.6.3.4.1.3.Tankers

13.6.3.4.1.4.Others

13.6.3.4.2.Inland Waterways transport vessel

13.6.3.4.3.Offshore Support Vessels (OSV)

13.6.4.Germany
13.6.4.1.Germany Marine Fuel Injection System Market Revenue (US$ Mn) and Forecasts, By Component Type
13.6.4.1.1.Fuel Injector

13.6.4.1.2.Fuel Pump

13.6.4.1.3.Fuel Valve

13.6.4.1.4.Electronic Control Unit (ECU)

13.6.4.1.5.Others

13.6.4.2.Germany Marine Fuel Injection System Market Revenue (US$ Mn) and Forecasts, By Engine Type
13.6.4.2.1.2-Stroke

13.6.4.2.2.4-Stroke

13.6.4.3.Germany Marine Fuel Injection System Market Revenue (US$ Mn) and Forecasts, By Power Rating
13.6.4.3.1.0 HP–2,000 HP

13.6.4.3.2.2,001 HP–10,000 HP

13.6.4.3.3.10,001 HP–20,000 HP

13.6.4.3.4.20,001 HP–50,000 HP

13.6.4.3.5.50,000 HP- 80,000 HP

13.6.4.3.6.Above 80,001 HP

13.6.4.4.Germany Marine Fuel Injection System Market Revenue (US$ Mn) and Forecasts, By Application
13.6.4.4.1.Commercial Vessels
13.6.4.4.1.1.Passenger Cruise

13.6.4.4.1.2.Bulk Carrier and Container Ships

13.6.4.4.1.3.Tankers

13.6.4.4.1.4.Others

13.6.4.4.2.Inland Waterways transport vessel

13.6.4.4.3.Offshore Support Vessels (OSV)

13.6.5.Italy
13.6.5.1.Italy Marine Fuel Injection System Market Revenue (US$ Mn) and Forecasts, By Component Type
13.6.5.1.1.Fuel Injector

13.6.5.1.2.Fuel Pump

13.6.5.1.3.Fuel Valve

13.6.5.1.4.Electronic Control Unit (ECU)

13.6.5.1.5.Others

13.6.5.2.Italy Marine Fuel Injection System Market Revenue (US$ Mn) and Forecasts, By Engine Type
13.6.5.2.1.2-Stroke

13.6.5.2.2.4-Stroke

13.6.5.3.Italy Marine Fuel Injection System Market Revenue (US$ Mn) and Forecasts, By Power Rating
13.6.5.3.1.0 HP–2,000 HP

13.6.5.3.2.2,001 HP–10,000 HP

13.6.5.3.3.10,001 HP–20,000 HP

13.6.5.3.4.20,001 HP–50,000 HP

13.6.5.3.5.50,000 HP- 80,000 HP

13.6.5.3.6.Above 80,001 HP

13.6.5.4.Italy Marine Fuel Injection System Market Revenue (US$ Mn) and Forecasts, By Application
13.6.5.4.1.Commercial Vessels
13.6.5.4.1.1.Passenger Cruise

13.6.5.4.1.2.Bulk Carrier and Container Ships

13.6.5.4.1.3.Tankers

13.6.5.4.1.4.Others

13.6.5.4.2.Inland Waterways transport vessel

13.6.5.4.3.Offshore Support Vessels (OSV)

13.6.6.Nordic Countries
13.6.6.1.Nordic Countries Marine Fuel Injection System Market Revenue (US$ Mn) and Forecasts, By Component Type
13.6.6.1.1.Fuel Injector

13.6.6.1.2.Fuel Pump

13.6.6.1.3.Fuel Valve

13.6.6.1.4.Electronic Control Unit (ECU)

13.6.6.1.5.Others

13.6.6.2.Nordic Countries Marine Fuel Injection System Market Revenue (US$ Mn) and Forecasts, By Engine Type
13.6.6.2.1.2-Stroke

13.6.6.2.2.4-Stroke

13.6.6.3.Nordic Countries Marine Fuel Injection System Market Revenue (US$ Mn) and Forecasts, By Power Rating
13.6.6.3.1.0 HP–2,000 HP

13.6.6.3.2.2,001 HP–10,000 HP

13.6.6.3.3.10,001 HP–20,000 HP

13.6.6.3.4.20,001 HP–50,000 HP

13.6.6.3.5.50,000 HP- 80,000 HP

13.6.6.3.6.Above 80,001 HP

13.6.6.4.Nordic Countries Marine Fuel Injection System Market Revenue (US$ Mn) and Forecasts, By Application
13.6.6.4.1.Commercial Vessels
13.6.6.4.1.1.Passenger Cruise

13.6.6.4.1.2.Bulk Carrier and Container Ships

13.6.6.4.1.3.Tankers

13.6.6.4.1.4.Others

13.6.6.4.2.Inland Waterways transport vessel

13.6.6.4.3.Offshore Support Vessels (OSV)

13.6.6.5.Nordic Countries Marine Fuel Injection System Market Revenue (US$ Mn) and Forecasts, By Country
13.6.6.5.1.Denmark

13.6.6.5.2.Finland

13.6.6.5.3.Iceland

13.6.6.5.4.Sweden

13.6.6.5.5.Norway

13.6.7.Benelux Union
13.6.7.1.Benelux Union Marine Fuel Injection System Market Revenue (US$ Mn) and Forecasts, By Component Type
13.6.7.1.1.Fuel Injector

13.6.7.1.2.Fuel Pump

13.6.7.1.3.Fuel Valve

13.6.7.1.4.Electronic Control Unit (ECU)

13.6.7.1.5.Others

13.6.7.2.Benelux Union Marine Fuel Injection System Market Revenue (US$ Mn) and Forecasts, By Engine Type
13.6.7.2.1.2-Stroke

13.6.7.2.2.4-Stroke

13.6.7.3.Benelux Union Marine Fuel Injection System Market Revenue (US$ Mn) and Forecasts, By Power Rating
13.6.7.3.1.0 HP–2,000 HP

13.6.7.3.2.2,001 HP–10,000 HP

13.6.7.3.3.10,001 HP–20,000 HP

13.6.7.3.4.20,001 HP–50,000 HP

13.6.7.3.5.50,000 HP- 80,000 HP

13.6.7.3.6.Above 80,001 HP

13.6.7.4.Benelux Union Marine Fuel Injection System Market Revenue (US$ Mn) and Forecasts, By Application
13.6.7.4.1.Commercial Vessels
13.6.7.4.1.1.Passenger Cruise

13.6.7.4.1.2.Bulk Carrier and Container Ships

13.6.7.4.1.3.Tankers

13.6.7.4.1.4.Others

13.6.7.4.2.Inland Waterways transport vessel

13.6.7.4.3.Offshore Support Vessels (OSV)

13.6.7.5.Benelux Union Marine Fuel Injection System Market Revenue (US$ Mn) and Forecasts, By Country
13.6.7.5.1.Belgium

13.6.7.5.2.The Netherlands

13.6.7.5.3.Luxembourg

13.6.8.Rest of Europe
13.6.8.1.Rest of Europe Marine Fuel Injection System Market Revenue (US$ Mn) and Forecasts, By Component Type
13.6.8.1.1.Fuel Injector

13.6.8.1.2.Fuel Pump

13.6.8.1.3.Fuel Valve

13.6.8.1.4.Electronic Control Unit (ECU)

13.6.8.1.5.Others

13.6.8.2.Rest of Europe Marine Fuel Injection System Market Revenue (US$ Mn) and Forecasts, By Engine Type
13.6.8.2.1.2-Stroke

13.6.8.2.2.4-Stroke

13.6.8.3.Rest of Europe Marine Fuel Injection System Market Revenue (US$ Mn) and Forecasts, By Power Rating
13.6.8.3.1.0 HP–2,000 HP

13.6.8.3.2.2,001 HP–10,000 HP

13.6.8.3.3.10,001 HP–20,000 HP

13.6.8.3.4.20,001 HP–50,000 HP

13.6.8.3.5.50,000 HP- 80,000 HP

13.6.8.3.6.Above 80,001 HP

13.6.8.4.Rest of Europe Marine Fuel Injection System Market Revenue (US$ Mn) and Forecasts, By Application
13.6.8.4.1.Commercial Vessels
13.6.8.4.1.1.Passenger Cruise

13.6.8.4.1.2.Bulk Carrier and Container Ships

13.6.8.4.1.3.Tankers

13.6.8.4.1.4.Others

13.6.8.4.2.Inland Waterways transport vessel

13.6.8.4.3.Offshore Support Vessels (OSV)

13.7.Key Segment for Channeling Investments
13.7.1.By Country

13.7.2.By Component Type

13.7.3.By Engine Type

13.7.4.By Power Rating

13.7.5.By Application

14.Asia Pacific Marine Fuel Injection System Market Analysis and Forecasts, 2024 – 2034
14.1.Overview
14.1.1.Asia Pacific Marine Fuel Injection System Market Revenue (US$ Mn)

14.2.Asia Pacific Marine Fuel Injection System Market Revenue (US$ Mn) and Forecasts, By Component Type
14.2.1.Fuel Injector

14.2.2.Fuel Pump

14.2.3.Fuel Valve

14.2.4.Electronic Control Unit (ECU)

14.2.5.Others

14.3.Asia Pacific Marine Fuel Injection System Market Revenue (US$ Mn) and Forecasts, By Engine Type
14.3.1.2-Stroke

14.3.2.4-Stroke

14.4.Asia Pacific Marine Fuel Injection System Market Revenue (US$ Mn) and Forecasts, By Power Rating
14.4.1.0 HP–2,000 HP

14.4.2.2,001 HP–10,000 HP

14.4.3.10,001 HP–20,000 HP

14.4.4.20,001 HP–50,000 HP

14.4.5.50,000 HP- 80,000 HP

14.4.6.Above 80,001 HP

14.5.Asia Pacific Marine Fuel Injection System Market Revenue (US$ Mn) and Forecasts, By Application
14.5.1.Commercial Vessels
14.5.1.1.Passenger Cruise

14.5.1.2.Bulk Carrier and Container Ships

14.5.1.3.Tankers

14.5.1.4.Others

14.5.2.Inland Waterways transport vessel

14.5.3.Offshore Support Vessels (OSV)

14.6.Asia Pacific Marine Fuel Injection System Market Revenue (US$ Mn) and Forecasts, By Country
14.6.1.China
14.6.1.1.China Marine Fuel Injection System Market Revenue (US$ Mn) and Forecasts, By Component Type
14.6.1.1.1.Fuel Injector

14.6.1.1.2.Fuel Pump

14.6.1.1.3.Fuel Valve

14.6.1.1.4.Electronic Control Unit (ECU)

14.6.1.1.5.Others

14.6.1.2.China Marine Fuel Injection System Market Revenue (US$ Mn) and Forecasts, By Engine Type
14.6.1.2.1.2-Stroke

14.6.1.2.2.4-Stroke

14.6.1.3.China Marine Fuel Injection System Market Revenue (US$ Mn) and Forecasts, By Power Rating
14.6.1.3.1.0 HP–2,000 HP

14.6.1.3.2.2,001 HP–10,000 HP

14.6.1.3.3.10,001 HP–20,000 HP

14.6.1.3.4.20,001 HP–50,000 HP

14.6.1.3.5.50,000 HP- 80,000 HP

14.6.1.3.6.Above 80,001 HP

14.6.1.4.China Marine Fuel Injection System Market Revenue (US$ Mn) and Forecasts, By Application
14.6.1.4.1.Commercial Vessels
14.6.1.4.1.1.Passenger Cruise

14.6.1.4.1.2.Bulk Carrier and Container Ships

14.6.1.4.1.3.Tankers

14.6.1.4.1.4.Others

14.6.1.4.2.Inland Waterways transport vessel

14.6.1.4.3.Offshore Support Vessels (OSV)

14.6.2.Japan
14.6.2.1.Japan Marine Fuel Injection System Market Revenue (US$ Mn) and Forecasts, By Component Type
14.6.2.1.1.Fuel Injector

14.6.2.1.2.Fuel Pump

14.6.2.1.3.Fuel Valve

14.6.2.1.4.Electronic Control Unit (ECU)

14.6.2.1.5.Others

14.6.2.2.Japan Marine Fuel Injection System Market Revenue (US$ Mn) and Forecasts, By Engine Type
14.6.2.2.1.2-Stroke

14.6.2.2.2.4-Stroke

14.6.2.3.Japan Marine Fuel Injection System Market Revenue (US$ Mn) and Forecasts, By Power Rating
14.6.2.3.1.0 HP–2,000 HP

14.6.2.3.2.2,001 HP–10,000 HP

14.6.2.3.3.10,001 HP–20,000 HP

14.6.2.3.4.20,001 HP–50,000 HP

14.6.2.3.5.50,000 HP- 80,000 HP

14.6.2.3.6.Above 80,001 HP

14.6.2.4.Japan Marine Fuel Injection System Market Revenue (US$ Mn) and Forecasts, By Application
14.6.2.4.1.Commercial Vessels
14.6.2.4.1.1.Passenger Cruise

14.6.2.4.1.2.Bulk Carrier and Container Ships

14.6.2.4.1.3.Tankers

14.6.2.4.1.4.Others

14.6.2.4.2.Inland Waterways transport vessel

14.6.2.4.3.Offshore Support Vessels (OSV)

14.6.3.India
14.6.3.1.India Marine Fuel Injection System Market Revenue (US$ Mn) and Forecasts, By Component Type
14.6.3.1.1.Fuel Injector

14.6.3.1.2.Fuel Pump

14.6.3.1.3.Fuel Valve

14.6.3.1.4.Electronic Control Unit (ECU)

14.6.3.1.5.Others

14.6.3.2.India Marine Fuel Injection System Market Revenue (US$ Mn) and Forecasts, By Engine Type
14.6.3.2.1.2-Stroke

14.6.3.2.2.4-Stroke

14.6.3.3.India Marine Fuel Injection System Market Revenue (US$ Mn) and Forecasts, By Power Rating
14.6.3.3.1.0 HP–2,000 HP

14.6.3.3.2.2,001 HP–10,000 HP

14.6.3.3.3.10,001 HP–20,000 HP

14.6.3.3.4.20,001 HP–50,000 HP

14.6.3.3.5.50,000 HP- 80,000 HP

14.6.3.3.6.Above 80,001 HP

14.6.3.4.India Marine Fuel Injection System Market Revenue (US$ Mn) and Forecasts, By Application
14.6.3.4.1.Commercial Vessels
14.6.3.4.1.1.Passenger Cruise

14.6.3.4.1.2.Bulk Carrier and Container Ships

14.6.3.4.1.3.Tankers

14.6.3.4.1.4.Others

14.6.3.4.2.Inland Waterways transport vessel

14.6.3.4.3.Offshore Support Vessels (OSV)

14.6.4.New Zealand
14.6.4.1.New Zealand Marine Fuel Injection System Market Revenue (US$ Mn) and Forecasts, By Component Type
14.6.4.1.1.Fuel Injector

14.6.4.1.2.Fuel Pump

14.6.4.1.3.Fuel Valve

14.6.4.1.4.Electronic Control Unit (ECU)

14.6.4.1.5.Others

14.6.4.2.New Zealand Marine Fuel Injection System Market Revenue (US$ Mn) and Forecasts, By Engine Type
14.6.4.2.1.2-Stroke

14.6.4.2.2.4-Stroke

14.6.4.3.New Zealand Marine Fuel Injection System Market Revenue (US$ Mn) and Forecasts, By Power Rating
14.6.4.3.1.0 HP–2,000 HP

14.6.4.3.2.2,001 HP–10,000 HP

14.6.4.3.3.10,001 HP–20,000 HP

14.6.4.3.4.20,001 HP–50,000 HP

14.6.4.3.5.50,000 HP- 80,000 HP

14.6.4.3.6.Above 80,001 HP

14.6.4.4.New Zealand Marine Fuel Injection System Market Revenue (US$ Mn) and Forecasts, By Application
14.6.4.4.1.Commercial Vessels
14.6.4.4.1.1.Passenger Cruise

14.6.4.4.1.2.Bulk Carrier and Container Ships

14.6.4.4.1.3.Tankers

14.6.4.4.1.4.Others

14.6.4.4.2.Inland Waterways transport vessel

14.6.4.4.3.Offshore Support Vessels (OSV)

14.6.5.Australia
14.6.5.1.Australia Marine Fuel Injection System Market Revenue (US$ Mn) and Forecasts, By Component Type
14.6.5.1.1.Fuel Injector

14.6.5.1.2.Fuel Pump

14.6.5.1.3.Fuel Valve

14.6.5.1.4.Electronic Control Unit (ECU)

14.6.5.1.5.Others

14.6.5.2.Australia Marine Fuel Injection System Market Revenue (US$ Mn) and Forecasts, By Engine Type
14.6.5.2.1.2-Stroke

14.6.5.2.2.4-Stroke

14.6.5.3.Australia Marine Fuel Injection System Market Revenue (US$ Mn) and Forecasts, By Power Rating
14.6.5.3.1.0 HP–2,000 HP

14.6.5.3.2.2,001 HP–10,000 HP

14.6.5.3.3.10,001 HP–20,000 HP

14.6.5.3.4.20,001 HP–50,000 HP

14.6.5.3.5.50,000 HP- 80,000 HP

14.6.5.3.6.Above 80,001 HP

14.6.5.4.Australia Marine Fuel Injection System Market Revenue (US$ Mn) and Forecasts, By Application
14.6.5.4.1.Commercial Vessels
14.6.5.4.1.1.Passenger Cruise

14.6.5.4.1.2.Bulk Carrier and Container Ships

14.6.5.4.1.3.Tankers

14.6.5.4.1.4.Others

14.6.5.4.2.Inland Waterways transport vessel

14.6.5.4.3.Offshore Support Vessels (OSV)

14.6.6.South Korea
14.6.6.1.South Korea Marine Fuel Injection System Market Revenue (US$ Mn) and Forecasts, By Component Type
14.6.6.1.1.Fuel Injector

14.6.6.1.2.Fuel Pump

14.6.6.1.3.Fuel Valve

14.6.6.1.4.Electronic Control Unit (ECU)

14.6.6.1.5.Others

14.6.6.2.South Korea Marine Fuel Injection System Market Revenue (US$ Mn) and Forecasts, By Engine Type
14.6.6.2.1.2-Stroke

14.6.6.2.2.4-Stroke

14.6.6.3.South Korea Marine Fuel Injection System Market Revenue (US$ Mn) and Forecasts, By Power Rating
14.6.6.3.1.0 HP–2,000 HP

14.6.6.3.2.2,001 HP–10,000 HP

14.6.6.3.3.10,001 HP–20,000 HP

14.6.6.3.4.20,001 HP–50,000 HP

14.6.6.3.5.50,000 HP- 80,000 HP

14.6.6.3.6.Above 80,001 HP

14.6.6.4.South Korea Marine Fuel Injection System Market Revenue (US$ Mn) and Forecasts, By Application
14.6.6.4.1.Commercial Vessels
14.6.6.4.1.1.Passenger Cruise

14.6.6.4.1.2.Bulk Carrier and Container Ships

14.6.6.4.1.3.Tankers

14.6.6.4.1.4.Others

14.6.6.4.2.Inland Waterways transport vessel

14.6.6.4.3.Offshore Support Vessels (OSV)

14.6.7.Southeast Asia
14.6.7.1.Southeast Asia Marine Fuel Injection System Market Revenue (US$ Mn) and Forecasts, By Component Type
14.6.7.1.1.Fuel Injector

14.6.7.1.2.Fuel Pump

14.6.7.1.3.Fuel Valve

14.6.7.1.4.Electronic Control Unit (ECU)

14.6.7.1.5.Others

14.6.7.2.Southeast Asia Marine Fuel Injection System Market Revenue (US$ Mn) and Forecasts, By Engine Type
14.6.7.2.1.2-Stroke

14.6.7.2.2.4-Stroke

14.6.7.3.Southeast Asia Marine Fuel Injection System Market Revenue (US$ Mn) and Forecasts, By Power Rating
14.6.7.3.1.0 HP–2,000 HP

14.6.7.3.2.2,001 HP–10,000 HP

14.6.7.3.3.10,001 HP–20,000 HP

14.6.7.3.4.20,001 HP–50,000 HP

14.6.7.3.5.50,000 HP- 80,000 HP

14.6.7.3.6.Above 80,001 HP

14.6.7.4.Southeast Asia Marine Fuel Injection System Market Revenue (US$ Mn) and Forecasts, By Application
14.6.7.4.1.Commercial Vessels
14.6.7.4.1.1.Passenger Cruise

14.6.7.4.1.2.Bulk Carrier and Container Ships

14.6.7.4.1.3.Tankers

14.6.7.4.1.4.Others

14.6.7.4.2.Inland Waterways transport vessel

14.6.7.4.3.Offshore Support Vessels (OSV)

14.6.7.5.Southeast Asia Marine Fuel Injection System Market Revenue (US$ Mn) and Forecasts, By Country
14.6.7.5.1.Indonesia

14.6.7.5.2.Thailand

14.6.7.5.3.Malaysia

14.6.7.5.4.Singapore

14.6.7.5.5.Rest of Southeast Asia

14.6.8.Rest of Asia Pacific
14.6.8.1.Rest of Asia Pacific Marine Fuel Injection System Market Revenue (US$ Mn) and Forecasts, By Component Type
14.6.8.1.1.Fuel Injector

14.6.8.1.2.Fuel Pump

14.6.8.1.3.Fuel Valve

14.6.8.1.4.Electronic Control Unit (ECU)

14.6.8.1.5.Others

14.6.8.2.Rest of Asia Pacific Marine Fuel Injection System Market Revenue (US$ Mn) and Forecasts, By Engine Type
14.6.8.2.1.2-Stroke

14.6.8.2.2.4-Stroke

14.6.8.3.Rest of Asia Pacific Marine Fuel Injection System Market Revenue (US$ Mn) and Forecasts, By Power Rating
14.6.8.3.1.0 HP–2,000 HP

14.6.8.3.2.2,001 HP–10,000 HP

14.6.8.3.3.10,001 HP–20,000 HP

14.6.8.3.4.20,001 HP–50,000 HP

14.6.8.3.5.50,000 HP- 80,000 HP

14.6.8.3.6.Above 80,001 HP

14.6.8.4.Rest of Asia Pacific Marine Fuel Injection System Market Revenue (US$ Mn) and Forecasts, By Application
14.6.8.4.1.Commercial Vessels
14.6.8.4.1.1.Passenger Cruise

14.6.8.4.1.2.Bulk Carrier and Container Ships

14.6.8.4.1.3.Tankers

14.6.8.4.1.4.Others

14.6.8.4.2.Inland Waterways transport vessel

14.6.8.4.3.Offshore Support Vessels (OSV)

14.7.Key Segment for Channeling Investments
14.7.1.By Country

14.7.2.By Component Type

14.7.3.By Engine Type

14.7.4.By Power Rating

14.7.5.By Application

15.Middle East and Africa Marine Fuel Injection System Market Analysis and Forecasts, 2024 – 2034
15.1.Overview
15.1.1.Middle East and Africa Marine Fuel Injection System Market Revenue (US$ Mn)

15.2.Middle East and Africa Marine Fuel Injection System Market Revenue (US$ Mn) and Forecasts, By Component Type
15.2.1.Fuel Injector

15.2.2.Fuel Pump

15.2.3.Fuel Valve

15.2.4.Electronic Control Unit (ECU)

15.2.5.Others

15.3.Middle East and Africa Marine Fuel Injection System Market Revenue (US$ Mn) and Forecasts, By Engine Type
15.3.1.2-Stroke

15.3.2.4-Stroke

15.4.Middle East and Africa Marine Fuel Injection System Market Revenue (US$ Mn) and Forecasts, By Power Rating
15.4.1.0 HP–2,000 HP

15.4.2.2,001 HP–10,000 HP

15.4.3.10,001 HP–20,000 HP

15.4.4.20,001 HP–50,000 HP

15.4.5.50,000 HP- 80,000 HP

15.4.6.Above 80,001 HP

15.5.Middle East and Africa Marine Fuel Injection System Market Revenue (US$ Mn) and Forecasts, By Application
15.5.1.Commercial Vessels
15.5.1.1.Passenger Cruise

15.5.1.2.Bulk Carrier and Container Ships

15.5.1.3.Tankers

15.5.1.4.Others

15.5.2.Inland Waterways transport vessel

15.5.3.Offshore Support Vessels (OSV)

15.6.Middle East and Africa Marine Fuel Injection System Market Revenue (US$ Mn) and Forecasts, By Country
15.6.1.Saudi Arabia
15.6.1.1.Saudi Arabia Marine Fuel Injection System Market Revenue (US$ Mn) and Forecasts, By Component Type
15.6.1.1.1.Fuel Injector

15.6.1.1.2.Fuel Pump

15.6.1.1.3.Fuel Valve

15.6.1.1.4.Electronic Control Unit (ECU)

15.6.1.1.5.Others

15.6.1.2.Saudi Arabia Marine Fuel Injection System Market Revenue (US$ Mn) and Forecasts, By Engine Type
15.6.1.2.1.2-Stroke

15.6.1.2.2.4-Stroke

15.6.1.3.Saudi Arabia Marine Fuel Injection System Market Revenue (US$ Mn) and Forecasts, By Power Rating
15.6.1.3.1.0 HP–2,000 HP

15.6.1.3.2.2,001 HP–10,000 HP

15.6.1.3.3.10,001 HP–20,000 HP

15.6.1.3.4.20,001 HP–50,000 HP

15.6.1.3.5.50,000 HP- 80,000 HP

15.6.1.3.6.Above 80,001 HP

15.6.1.4.Saudi Arabia Marine Fuel Injection System Market Revenue (US$ Mn) and Forecasts, By Application
15.6.1.4.1.Commercial Vessels
15.6.1.4.1.1.Passenger Cruise

15.6.1.4.1.2.Bulk Carrier and Container Ships

15.6.1.4.1.3.Tankers

15.6.1.4.1.4.Others

15.6.1.4.2.Inland Waterways transport vessel

15.6.1.4.3.Offshore Support Vessels (OSV)

15.6.2.UAE
15.6.2.1.UAE Marine Fuel Injection System Market Revenue (US$ Mn) and Forecasts, By Component Type
15.6.2.1.1.Fuel Injector

15.6.2.1.2.Fuel Pump

15.6.2.1.3.Fuel Valve

15.6.2.1.4.Electronic Control Unit (ECU)

15.6.2.1.5.Others

15.6.2.2.UAE Marine Fuel Injection System Market Revenue (US$ Mn) and Forecasts, By Engine Type
15.6.2.2.1.2-Stroke

15.6.2.2.2.4-Stroke

15.6.2.3.UAE Marine Fuel Injection System Market Revenue (US$ Mn) and Forecasts, By Power Rating
15.6.2.3.1.0 HP–2,000 HP

15.6.2.3.2.2,001 HP–10,000 HP

15.6.2.3.3.10,001 HP–20,000 HP

15.6.2.3.4.20,001 HP–50,000 HP

15.6.2.3.5.50,000 HP- 80,000 HP

15.6.2.3.6.Above 80,001 HP

15.6.2.4.UAE Marine Fuel Injection System Market Revenue (US$ Mn) and Forecasts, By Application
15.6.2.4.1.Commercial Vessels
15.6.2.4.1.1.Passenger Cruise

15.6.2.4.1.2.Bulk Carrier and Container Ships

15.6.2.4.1.3.Tankers

15.6.2.4.1.4.Others

15.6.2.4.2.Inland Waterways transport vessel

15.6.2.4.3.Offshore Support Vessels (OSV)

15.6.3.Egypt
15.6.3.1.Egypt Marine Fuel Injection System Market Revenue (US$ Mn) and Forecasts, By Component Type
15.6.3.1.1.Fuel Injector

15.6.3.1.2.Fuel Pump

15.6.3.1.3.Fuel Valve

15.6.3.1.4.Electronic Control Unit (ECU)

15.6.3.1.5.Others

15.6.3.2.Egypt Marine Fuel Injection System Market Revenue (US$ Mn) and Forecasts, By Engine Type
15.6.3.2.1.2-Stroke

15.6.3.2.2.4-Stroke

15.6.3.3.Egypt Marine Fuel Injection System Market Revenue (US$ Mn) and Forecasts, By Power Rating
15.6.3.3.1.0 HP–2,000 HP

15.6.3.3.2.2,001 HP–10,000 HP

15.6.3.3.3.10,001 HP–20,000 HP

15.6.3.3.4.20,001 HP–50,000 HP

15.6.3.3.5.50,000 HP- 80,000 HP

15.6.3.3.6.Above 80,001 HP

15.6.3.4.Egypt Marine Fuel Injection System Market Revenue (US$ Mn) and Forecasts, By Application
15.6.3.4.1.Commercial Vessels
15.6.3.4.1.1.Passenger Cruise

15.6.3.4.1.2.Bulk Carrier and Container Ships

15.6.3.4.1.3.Tankers

15.6.3.4.1.4.Others

15.6.3.4.2.Inland Waterways transport vessel

15.6.3.4.3.Offshore Support Vessels (OSV)

15.6.4.Kuwait
15.6.4.1.Kuwait Marine Fuel Injection System Market Revenue (US$ Mn) and Forecasts, By Component Type
15.6.4.1.1.Fuel Injector

15.6.4.1.2.Fuel Pump

15.6.4.1.3.Fuel Valve

15.6.4.1.4.Electronic Control Unit (ECU)

15.6.4.1.5.Others

15.6.4.2.Kuwait Marine Fuel Injection System Market Revenue (US$ Mn) and Forecasts, By Engine Type
15.6.4.2.1.2-Stroke

15.6.4.2.2.4-Stroke

15.6.4.3.Kuwait Marine Fuel Injection System Market Revenue (US$ Mn) and Forecasts, By Power Rating
15.6.4.3.1.0 HP–2,000 HP

15.6.4.3.2.2,001 HP–10,000 HP

15.6.4.3.3.10,001 HP–20,000 HP

15.6.4.3.4.20,001 HP–50,000 HP

15.6.4.3.5.50,000 HP- 80,000 HP

15.6.4.3.6.Above 80,001 HP

15.6.4.4.Kuwait Marine Fuel Injection System Market Revenue (US$ Mn) and Forecasts, By Application
15.6.4.4.1.Commercial Vessels
15.6.4.4.1.1.Passenger Cruise

15.6.4.4.1.2.Bulk Carrier and Container Ships

15.6.4.4.1.3.Tankers

15.6.4.4.1.4.Others

15.6.4.4.2.Inland Waterways transport vessel

15.6.4.4.3.Offshore Support Vessels (OSV)

15.6.5.South Africa
15.6.5.1.South Africa Marine Fuel Injection System Market Revenue (US$ Mn) and Forecasts, By Component Type
15.6.5.1.1.Fuel Injector

15.6.5.1.2.Fuel Pump

15.6.5.1.3.Fuel Valve

15.6.5.1.4.Electronic Control Unit (ECU)

15.6.5.1.5.Others

15.6.5.2.South Africa Marine Fuel Injection System Market Revenue (US$ Mn) and Forecasts, By Engine Type
15.6.5.2.1.2-Stroke

15.6.5.2.2.4-Stroke

15.6.5.3.South Africa Marine Fuel Injection System Market Revenue (US$ Mn) and Forecasts, By Power Rating
15.6.5.3.1.0 HP–2,000 HP

15.6.5.3.2.2,001 HP–10,000 HP

15.6.5.3.3.10,001 HP–20,000 HP

15.6.5.3.4.20,001 HP–50,000 HP

15.6.5.3.5.50,000 HP- 80,000 HP

15.6.5.3.6.Above 80,001 HP

15.6.5.4.South Africa Marine Fuel Injection System Market Revenue (US$ Mn) and Forecasts, By Application
15.6.5.4.1.Commercial Vessels
15.6.5.4.1.1.Passenger Cruise

15.6.5.4.1.2.Bulk Carrier and Container Ships

15.6.5.4.1.3.Tankers

15.6.5.4.1.4.Others

15.6.5.4.2.Inland Waterways transport vessel

15.6.5.4.3.Offshore Support Vessels (OSV)

15.6.6.Rest of Middle East & Africa
15.6.6.1.Rest of Middle East & Africa Marine Fuel Injection System Market Revenue (US$ Mn) and Forecasts, By Component Type
15.6.6.1.1.Fuel Injector

15.6.6.1.2.Fuel Pump

15.6.6.1.3.Fuel Valve

15.6.6.1.4.Electronic Control Unit (ECU)

15.6.6.1.5.Others

15.6.6.2.Rest of Middle East & Africa Marine Fuel Injection System Market Revenue (US$ Mn) and Forecasts, By Engine Type
15.6.6.2.1.2-Stroke

15.6.6.2.2.4-Stroke

15.6.6.3.Rest of Middle East & Africa Marine Fuel Injection System Market Revenue (US$ Mn) and Forecasts, By Power Rating
15.6.6.3.1.0 HP–2,000 HP

15.6.6.3.2.2,001 HP–10,000 HP

15.6.6.3.3.10,001 HP–20,000 HP

15.6.6.3.4.20,001 HP–50,000 HP

15.6.6.3.5.50,000 HP- 80,000 HP

15.6.6.3.6.Above 80,001 HP

15.6.6.4.Rest of Middle East & Africa Marine Fuel Injection System Market Revenue (US$ Mn) and Forecasts, By Application
15.6.6.4.1.Commercial Vessels
15.6.6.4.1.1.Passenger Cruise

15.6.6.4.1.2.Bulk Carrier and Container Ships

15.6.6.4.1.3.Tankers

15.6.6.4.1.4.Others

15.6.6.4.2.Inland Waterways transport vessel

15.6.6.4.3.Offshore Support Vessels (OSV)

15.7.Key Segment for Channeling Investments
15.7.1.By Country

15.7.2.By Component Type

15.7.3.By Engine Type

15.7.4.By Power Rating

15.7.5.By Application

16.Latin America Marine Fuel Injection System Market Analysis and Forecasts, 2024 – 2034
16.1.Overview
16.1.1.Latin America Marine Fuel Injection System Market Revenue (US$ Mn)

16.2.Latin America Marine Fuel Injection System Market Revenue (US$ Mn) and Forecasts, By Component Type
16.2.1.Fuel Injector

16.2.2.Fuel Pump

16.2.3.Fuel Valve

16.2.4.Electronic Control Unit (ECU)

16.2.5.Others

16.3.Latin America Marine Fuel Injection System Market Revenue (US$ Mn) and Forecasts, By Engine Type
16.3.1.2-Stroke

16.3.2.4-Stroke

16.4.Latin America Marine Fuel Injection System Market Revenue (US$ Mn) and Forecasts, By Power Rating
16.4.1.0 HP–2,000 HP

16.4.2.2,001 HP–10,000 HP

16.4.3.10,001 HP–20,000 HP

16.4.4.20,001 HP–50,000 HP

16.4.5.50,000 HP- 80,000 HP

16.4.6.Above 80,001 HP

16.5.Latin America Marine Fuel Injection System Market Revenue (US$ Mn) and Forecasts, By Application
16.5.1.Commercial Vessels
16.5.1.1.Passenger Cruise

16.5.1.2.Bulk Carrier and Container Ships

16.5.1.3.Tankers

16.5.1.4.Others

16.5.2.Inland Waterways transport vessel

16.5.3.Offshore Support Vessels (OSV)

16.6.Latin America Marine Fuel Injection System Market Revenue (US$ Mn) and Forecasts, By Country
16.6.1.Brazil
16.6.1.1.Brazil Marine Fuel Injection System Market Revenue (US$ Mn) and Forecasts, By Component Type
16.6.1.1.1.Fuel Injector

16.6.1.1.2.Fuel Pump

16.6.1.1.3.Fuel Valve

16.6.1.1.4.Electronic Control Unit (ECU)

16.6.1.1.5.Others

16.6.1.2.Brazil Marine Fuel Injection System Market Revenue (US$ Mn) and Forecasts, By Engine Type
16.6.1.2.1.2-Stroke

16.6.1.2.2.4-Stroke

16.6.1.3.Brazil Marine Fuel Injection System Market Revenue (US$ Mn) and Forecasts, By Power Rating
16.6.1.3.1.0 HP–2,000 HP

16.6.1.3.2.2,001 HP–10,000 HP

16.6.1.3.3.10,001 HP–20,000 HP

16.6.1.3.4.20,001 HP–50,000 HP

16.6.1.3.5.50,000 HP- 80,000 HP

16.6.1.3.6.Above 80,001 HP

16.6.1.4.Brazil Marine Fuel Injection System Market Revenue (US$ Mn) and Forecasts, By Application
16.6.1.4.1.Commercial Vessels
16.6.1.4.1.1.Passenger Cruise

16.6.1.4.1.2.Bulk Carrier and Container Ships

16.6.1.4.1.3.Tankers

16.6.1.4.1.4.Others

16.6.1.4.2.Inland Waterways transport vessel

16.6.1.4.3.Offshore Support Vessels (OSV)

16.6.2.Argentina
16.6.2.1.Argentina Marine Fuel Injection System Market Revenue (US$ Mn) and Forecasts, By Component Type
16.6.2.1.1.Fuel Injector

16.6.2.1.2.Fuel Pump

16.6.2.1.3.Fuel Valve

16.6.2.1.4.Electronic Control Unit (ECU)

16.6.2.1.5.Others

16.6.2.2.Argentina Marine Fuel Injection System Market Revenue (US$ Mn) and Forecasts, By Engine Type
16.6.2.2.1.2-Stroke

16.6.2.2.2.4-Stroke

16.6.2.3.Argentina Marine Fuel Injection System Market Revenue (US$ Mn) and Forecasts, By Power Rating
16.6.2.3.1.0 HP–2,000 HP

16.6.2.3.2.2,001 HP–10,000 HP

16.6.2.3.3.10,001 HP–20,000 HP

16.6.2.3.4.20,001 HP–50,000 HP

16.6.2.3.5.50,000 HP- 80,000 HP

16.6.2.3.6.Above 80,001 HP

16.6.2.4.Argentina Marine Fuel Injection System Market Revenue (US$ Mn) and Forecasts, By Application
16.6.2.4.1.Commercial Vessels
16.6.2.4.1.1.Passenger Cruise

16.6.2.4.1.2.Bulk Carrier and Container Ships

16.6.2.4.1.3.Tankers

16.6.2.4.1.4.Others

16.6.2.4.2.Inland Waterways transport vessel

16.6.2.4.3.Offshore Support Vessels (OSV)

16.6.3.Rest of Latin America
16.6.3.1.Rest of Latin America Marine Fuel Injection System Market Revenue (US$ Mn) and Forecasts, By Component Type
16.6.3.1.1.Fuel Injector

16.6.3.1.2.Fuel Pump

16.6.3.1.3.Fuel Valve

16.6.3.1.4.Electronic Control Unit (ECU)

16.6.3.1.5.Others

16.6.3.2.Rest of Latin America Marine Fuel Injection System Market Revenue (US$ Mn) and Forecasts, By Engine Type
16.6.3.2.1.2-Stroke

16.6.3.2.2.4-Stroke

16.6.3.3.Rest of Latin America Marine Fuel Injection System Market Revenue (US$ Mn) and Forecasts, By Power Rating
16.6.3.3.1.0 HP–2,000 HP

16.6.3.3.2.2,001 HP–10,000 HP

16.6.3.3.3.10,001 HP–20,000 HP

16.6.3.3.4.20,001 HP–50,000 HP

16.6.3.3.5.50,000 HP- 80,000 HP

16.6.3.3.6.Above 80,001 HP

16.6.3.4.Rest of Latin America Marine Fuel Injection System Market Revenue (US$ Mn) and Forecasts, By Application
16.6.3.4.1.Commercial Vessels
16.6.3.4.1.1.Passenger Cruise

16.6.3.4.1.2.Bulk Carrier and Container Ships

16.6.3.4.1.3.Tankers

16.6.3.4.1.4.Others

16.6.3.4.2.Inland Waterways transport vessel

16.6.3.4.3.Offshore Support Vessels (OSV)

16.7.Key Segment for Channeling Investments
16.7.1.By Country

16.7.2.By Component Type

16.7.3.By Engine Type

16.7.4.By Power Rating

16.7.5.By Application

17.Competitive Benchmarking
17.1.Brand Benchmarking

17.2.Market Share Analysis, 2023

17.3.Global Presence and Growth Strategies
17.3.1.Mergers and Acquisitions

17.3.2.Product Launches

17.3.3.Investments Trends

17.3.4.R&D Initiatives

18.Player Profiles
18.1.Caterpillar Inc.
18.1.1.Company Details

18.1.2.Company Overview

18.1.3.Product Offerings

18.1.4.Key Developments

18.1.5.Financial Analysis

18.1.6.SWOT Analysis

18.1.7.Business Strategies

18.2.Delphi Automotive Plc
18.2.1.Company Details

18.2.2.Company Overview

18.2.3.Product Offerings

18.2.4.Key Developments

18.2.5.Financial Analysis

18.2.6.SWOT Analysis

18.2.7.Business Strategies

18.3.DENSO Corporation
18.3.1.Company Details

18.3.2.Company Overview

18.3.3.Product Offerings

18.3.4.Key Developments

18.3.5.Financial Analysis

18.3.6.SWOT Analysis

18.3.7.Business Strategies

18.4.Heinzmann GmbH & Co. KG
18.4.1.Company Details

18.4.2.Company Overview

18.4.3.Product Offerings

18.4.4.Key Developments

18.4.5.Financial Analysis

18.4.6.SWOT Analysis

18.4.7.Business Strategies

18.5.Liebherr International AG
18.5.1.Company Details

18.5.2.Company Overview

18.5.3.Product Offerings

18.5.4.Key Developments

18.5.5.Financial Analysis

18.5.6.SWOT Analysis

18.5.7.Business Strategies

18.6.MAN SE
18.6.1.Company Details

18.6.2.Company Overview

18.6.3.Product Offerings

18.6.4.Key Developments

18.6.5.Financial Analysis

18.6.6.SWOT Analysis

18.6.7.Business Strategies

18.7.Marren Fuel Injection
18.7.1.Company Details

18.7.2.Company Overview

18.7.3.Product Offerings

18.7.4.Key Developments

18.7.5.Financial Analysis

18.7.6.SWOT Analysis

18.7.7.Business Strategies

18.8.OMT – Officine Meccaniche Torino SpA
18.8.1.Company Details

18.8.2.Company Overview

18.8.3.Product Offerings

18.8.4.Key Developments

18.8.5.Financial Analysis

18.8.6.SWOT Analysis

18.8.7.Business Strategies

18.9.Robert Bosch GmbH
18.9.1.Company Details

18.9.2.Company Overview

18.9.3.Product Offerings

18.9.4.Key Developments

18.9.5.Financial Analysis

18.9.6.SWOT Analysis

18.9.7.Business Strategies

18.10.Rolls-Royce Power Systems AG
18.10.1.Company Details

18.10.2.Company Overview

18.10.3.Product Offerings

18.10.4.Key Developments

18.10.5.Financial Analysis

18.10.6.SWOT Analysis

18.10.7.Business Strategies

18.11.Suzuki Motor Corporation
18.11.1.Company Details

18.11.2.Company Overview

18.11.3.Product Offerings

18.11.4.Key Developments

18.11.5.Financial Analysis

18.11.6.SWOT Analysis

18.11.7.Business Strategies

18.12.Walbro LLC
18.12.1.Company Details

18.12.2.Company Overview

18.12.3.Product Offerings

18.12.4.Key Developments

18.12.5.Financial Analysis

18.12.6.SWOT Analysis

18.12.7.Business Strategies

18.13.Yanmar Co. Ltd
18.13.1.Company Details

18.13.2.Company Overview

18.13.3.Product Offerings

18.13.4.Key Developments

18.13.5.Financial Analysis

18.13.6.SWOT Analysis

18.13.7.Business Strategies

18.14.Other Market Participants

19.Key Findings

.

**Exclusive for Multi-User and Enterprise User.

.

Global Marine Fuel Injection System Market

By Component Type

  • Fuel Injector
  • Fuel Pump
  • Fuel Valve
  • Electronic Control Unit (ECU)
  • Others

By Engine Type

  • 2-Stroke
  • 4-Stroke

By Power Rating

  • 0 HP–2,000 HP
  • 2,001 HP–10,000 HP
  • 10,001 HP–20,000 HP
  • 20,001 HP–50,000 HP
  • 50,000 HP- 80,000 HP
  • Above 80,001 HP

By Application

  • Commercial Vessels
    • Passenger Cruise
    • Bulk Carrier & Container Ships
    • Tankers
    • Others
  • Inland Waterways transport vessel
  • Offshore Support Vessels (OSV)

By Region

  • North America (U.S., Canada, Mexico, Rest of North America)
  • Europe (France, The UK, Spain, Germany, Italy, Nordic Countries (Denmark, Finland, Iceland, Sweden, Norway), Benelux Union (Belgium, The Netherlands, Luxembourg), Rest of Europe)
  • Asia Pacific (China, Japan, India, New Zealand, Australia, South Korea, Southeast Asia (Indonesia, Thailand, Malaysia, Singapore, Rest of Southeast Asia), Rest of Asia Pacific)
  • Middle East & Africa (Saudi Arabia, UAE, Egypt, Kuwait, South Africa, Rest of Middle East & Africa)
  • Latin America (Brazil, Argentina, Rest of Latin America)


.

The Niche Research approach encompasses both primary and secondary research methods to provide comprehensive insights. While primary research is the cornerstone of our studies, we also incorporate secondary research sources such as company annual reports, premium industry databases, press releases, industry journals, and white papers.

Within our primary research, we actively engage with various industry stakeholders, conducting paid interviews and surveys. Our meticulous analysis extends to every market participant in major countries, allowing us to thoroughly examine their portfolios, calculate market shares, and segment revenues.

Our data collection primarily focuses on individual countries within our research scope, enabling us to estimate regional market sizes. Typically, we employ a bottom-up approach, meticulously tracking trends in different countries. We analyze growth drivers, constraints, technological innovations, and opportunities for each country, ultimately arriving at regional figures.Our process begins by examining the growth prospects of each country. Building upon these insights, we project growth and trends for the entire region. Finally, we utilize our proprietary model to refine estimations and forecasts.

Our data validation standards are integral to ensuring the reliability and accuracy of our research findings. Here’s a breakdown of our data validation processes and the stakeholders we engage with during our primary research:

  • Supply Side Analysis: We initiate a supply side analysis by directly contacting market participants, through telephonic interviews and questionnaires containing both open-ended and close-ended questions. We gather information on their portfolios, segment revenues, developments, and growth strategies.
  • Demand Side Analysis: To gain insights into adoption trends and consumer preferences, we reach out to target customers and users (non-vendors). This information forms a vital part of the qualitative analysis section of our reports, covering market dynamics, adoption trends, consumer behavior, spending patterns, and other related aspects.
  • Consultant Insights: We tap into the expertise of our partner consultants from around the world to obtain their unique viewpoints and perspectives. Their insights contribute to a well-rounded understanding of the markets under investigation.
  • In-House Validation: To ensure data accuracy and reliability, we conduct cross-validation of data points and information through our in-house team of consultants and utilize advanced data modeling tools for thorough verification.

The forecasts we provide are based on a comprehensive assessment of various factors, including:

  • Market Trends and Past Performance (Last Five Years): We accurately analyze market trends and performance data from preceding five years to identify historical patterns and understand the market’s evolution.
  • Historical Performance and Growth of Market Participants: We assess the historical performance and growth trajectories of key market participants. This analysis provides insights into the competitive landscape and individual company strategies.
  • Market Determinants Impact Analysis (Next Eight Years): We conduct a rigorous analysis of the factors that are projected to influence the market over the next eight years. This includes assessing both internal and external determinants that can shape market dynamics.
  • Drivers and Challenges for the Forecast Period:Identify the factors expected to drive market growth during the forecast period, as well as the challenges that the industry may face. This analysis aids in deriving an accurate growth rate projection.
  • New Acquisitions, Collaborations, or Partnerships: We keep a close watch on any new acquisitions, collaborations, or partnerships within the industry. These developments can have a significant impact on market dynamics and competitiveness.
  • Macro and Micro Factors Analysis:A thorough examination of both macro-level factors (e.g., economic trends, regulatory changes) and micro-level factors (e.g., technological advancements, consumer preferences) that may influence the market during the forecast period.
  • End-User Sentiment Analysis: To understand the market from the end-user perspective, we conduct sentiment analysis. This involves assessing the sentiment, preferences, and feedback of the end-users, which can provide valuable insights into market trends.
  • Perspective of Primary Participants: Insights gathered directly from primary research participants play a crucial role in shaping our forecasts. Their perspectives and experiences provide valuable qualitative data.
  • Year-on-Year Growth Trend: We utilize a year-on-year growth trend based on historical market growth and expected future trends. This helps in formulating our growth projections, aligning them with the market’s historical performance.

Research process adopted by TNR involves multiple stages, including data collection, validation, quality checks, and presentation. It’s crucial that the data and information we provide add value to your existing market understanding and expertise. We have also established partnerships with business consulting, research, and survey organizations across regions and globally to collaborate on regional analysis and data validation, ensuring the highest level of accuracy and reliability in our reports.


Procure Comprehensive Study of

Global Marine Fuel Injection System Market

Online Only

  • Online Access
  • Read Only File
  • Validity 3 Months
  • Print, Copy, Paste & Download
  • PPT, Excel
  • Cost-Free Report in the Next Update
$3300
Buy Now

Single User

  • Access to One User on One System
  • Read Only File
  • Validity 6 Months
  • Limited Print,Copy, Paste
  • PPT, Excel
  • Cost-Free Report in the Next Update
$4200
Buy Now

Multi User

  • Access to Fiver Users
  • PDF File
  • Validity 1 Year
  • Upto FivePrints
  • Cost-Free Report in the Next Update
  • PPT, Excel
$6000
Buy Now

Enterprise User

  • Access to Unlimited Users
  • PDF, PPT, Excel
  • Unlimited Validity, Prints&Downloads
  • 1 Hour Cost-Free & Dedicated Analyst Support
  • 10% Cost-Free Customization
  • Cost-Free Report Update Twice in a Year
  • Recommendations for Business Strategies
  • Authorization to Quote TNR, The Niche Research
$7300
Buy Now

Library Access

  • Online Access to Content Publications
  • Access Player Profiles Online
  • Get Immediate Access to Newly Added Content
  • Acquire 12 PDF Downloads
  • Acquire 5 Excel Data Sets
  • Gain Access to 290+ PDFs of Company Profiles
  • Round-the-clock Email and Phone Assistance
  • Dashboard Usage and Trends
  • Renewal & Upgrade Assistance
  • Assessing Customization Options and Alerts for New Reports
$10788
Buy Now
*Taxes/Fees, if applicable will be added during checkout. All prices in USD

Why TNR The Niche Research?

  • Unwavering Commitment to Excellence

  • Veteran Team of Researchers

  • Accurate and Timely Insights

  • Ethical Practices and Customized Service

  • Uninterrupted Availability Around the Clock

Scroll to Top