Global Neurological Biomarkers Market, By Type, By Application, By End Use, By Region & Segmental Insights Trends and Forecast, 2023 – 2031

  • Industry: Healthcare
  • Report ID: TNR-110-945
  • Number of Pages: 420
  • Table/Charts : Yes
  • November, 2023
  • Base Year : 2024
  • No. of Companies : 7+
  • No. of Countries : 29
  • Views : 10095
  • Covid Impact Covered: Yes
  • War Impact Covered: Yes
  • Formats : PDF, Excel, PPT

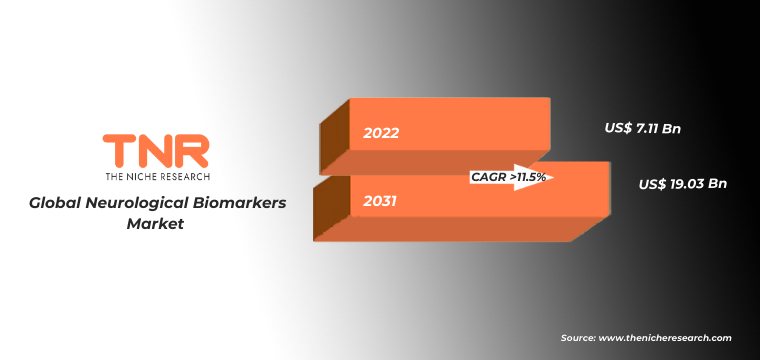
Neurological biomarkers are measurable biological indicators found in bodily fluids or brain scans that provide information about the presence, progression, or risk of neurological disorders such as Alzheimer’s disease or Parkinson’s disease. They aid in diagnosis, monitoring, and research, offering insights into neurological health and disease-related changes. In terms of revenue, the global neurological biomarkers market was worth US$ 7.11 Bn in 2022, anticipated to witness CAGR of 11.5% during 2023 – 2031.

Global Neurological Biomarkers Market Revenue & Forecast, (US$ Million), 2015 – 2031

Trends in the Global Neurological Biomarkers Market

Currently, advancements in brain imaging technologies are revolutionizing the neurological biomarkers market. Cutting-edge techniques like functional MRI (fMRI) and positron emission tomography (PET) scans are enabling real-time observation of neurological processes. This continuous development enhances our ability to identify and measure biomarkers, allowing for earlier disease detection and personalized treatment plans. The ongoing refinement of these imaging modalities is bolstering their role in neuroscience research and clinical applications, further propelling the market’s growth.

Report Coverage and Deliverables: 

Precision medicine is playing an increasingly vital role in shaping the neurological biomarkers market. The trend involves tailoring treatments based on individual patient characteristics, including biomarker profiles. Currently, healthcare providers are integrating genetic and molecular biomarker data into clinical decision-making processes. This tailored approach enhances treatment efficacy, thereby reducing adverse effects, which in turn will improve patient outcomes. With ongoing research and the growing availability of biomarker-based therapies, precision medicine continues to be a driving force in the neurological biomarkers sector, promising more effective treatments for patients.

Metabolomic segment has gained popularity in recent years and is anticipated to be the fastest growing segment in the global neurological biomarkers market during the forecast period. This growth can be attributed to its ability to capture dynamic metabolic changes associated with neurological disorders. Metabolomics, aided by advanced spectroscopy and analytical techniques, enables the identification of small molecule metabolites in bodily fluids. This approach has revealed distinct metabolic profiles in conditions like multiple sclerosis and Parkinson’s disease. A study published in the journal ‘Frontiers in Neurology’ reported significant alterations in metabolomic profiles of patients with neurodegenerative disorders. The ability to detect subtle metabolic variations is positioning metabolomic biomarkers as a vital tool for early diagnosis, disease progression monitoring, and the development of targeted therapies, fueling their rapid growth in the market.

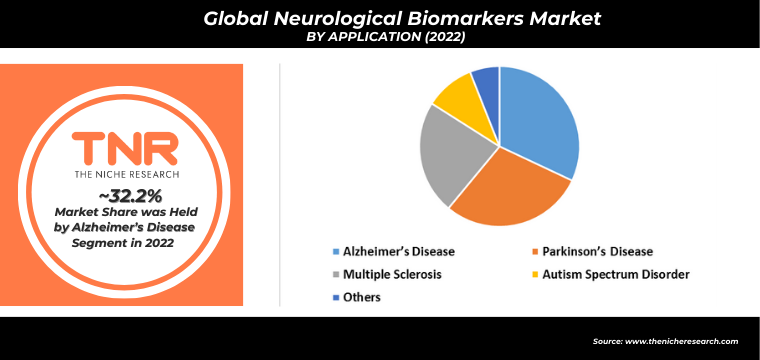
Alzheimer’s disease segment had the highest share in the global neurological biomarkers market in 2022. This is primarily attributed to its staggering prevalence and socioeconomic impact. Alzheimer’s disease has affected millions of people worldwide, accounting for the majority of neurological disorders. According to the study, nearly 50 million people were living with dementia in 2020, with Alzheimer’s constituting the majority of cases. This prevalence drives substantial research and investment in biomarker development for early detection and intervention. Prominent biomarkers, such as amyloid-beta and tau proteins, have gained prominence. The urgent need for effective Alzheimer’s diagnostics and therapeutics underscores its dominant position in the neurological biomarkers landscape, fostering innovation and collaboration in the healthcare industry.

Asia Pacific is expected to witness the highest growth rate in the neurological biomarkers market during the forecast period. The growth is driven by a surge in neurological disorders. Statistics indicate a substantial increase in neurological disease incidence, with millions affected. This growth is driven by factors such as aging populations, urbanization, and lifestyle changes in countries like China and India. Increasing healthcare expenditure and rising awareness of early diagnosis are fostering biomarker research and development. Collaboration with international partners and the establishment of biomarker-related databases and initiatives signify the region’s commitment to advancing neurological biomarker adoption. The Asia Pacific’s rapid economic growth and healthcare evolution underpin its accelerated expansion in this market.

Competitive Landscape

Some of the players operating in the neurological biomarkers market are

  • Abbott
  • BIOMERIEUX
  • Bio-Rad Laboratories, Inc.
  • Johnson & Johnson Services, Inc.
  • Merck KGaA
  • Quanterix
  • Rules-Based Medicine
  • Thermo Fisher Scientific Inc.
  • Other Industry Participants

Report Summary of Global Neurological Biomarkers Market

Report Specifications Details
Market Revenue in 2022 US$ 7.11 Billion
Market Size Forecast by 2031 US$ 19.03 Billion
Growth Rate (CAGR) 11.5%
Historic Data 2015 – 2021
Base Year for Estimation 2022
Forecast Period 2023 – 2031
Report Inclusions Market Size & Estimates, Market Dynamics, Competitive Scenario, Trends, Growth Factors, Market Determinants, Key Investment Segmentation, Product/Service/Solutions Benchmarking
Segments Covered By Type, By Application, By End Use
Regions Covered North America, Europe, Asia Pacific, Middle East & Africa, Latin America
Countries Covered U.S., Canada, Mexico, Rest of North America,  France, The UK, Spain, Germany, Italy, Nordic Countries (Denmark, Finland, Iceland, Sweden, Norway), Benelux Union (Belgium, The Netherlands, Luxembourg), Rest of Europe,  China, Japan, India, New Zealand, Australia, South Korea, Southeast Asia (Indonesia, Thailand, Malaysia, Singapore, Rest of Southeast Asia), Rest of Asia Pacific,  Saudi Arabia, UAE, Egypt, Kuwait, South Africa, Rest of Middle East & Africa,  Brazil, Argentina, Rest of Latin America
Key Players Abbott, BIOMERIEUX, Bio-Rad Laboratories, Inc., Johnson & Johnson Services, Inc., Merck KGaA, Quanterix, Rules-Based Medicine, Thermo Fisher Scientific Inc., Other Industry Participants
Customization Scope Customization allows for the inclusion/modification of content pertaining to geographical regions, countries, and specific market segments.
Pricing & Procurement Options Explore purchase options tailored to your specific research requirements
Contact Details Consult With Our Expert

Japan (Toll-Free): – +81 663-386-8111

South Korea (Toll-Free): – +82-808- 703-126

Saudi Arabia (Toll-Free): – +966 800 850 1643

United States: +1 302-232-5106

United Kingdom: +447537105080

E-mail:  askanexpert@thenicheresearch.com


Global Neurological Biomarkers Market

By Type

  • Genomic
  • Proteomic
  • Metabolomic
  • Imaging
  • Others

By Application

  • Alzheimer’s Disease
  • Parkinson’s Disease
  • Multiple Sclerosis
  • Autism Spectrum Disorder
  • Others

By End Use

  • Hospital & Hospital Laboratories
  • Independent Clinical Diagnostic Centers
  • Research Organizations And Others

By Region

  • North America (U.S., Canada, Mexico, Rest of North America)
  • Europe (France, The UK, Spain, Germany, Italy, Nordic Countries (Denmark, Finland, Iceland, Sweden, Norway), Benelux Union (Belgium, The Netherlands, Luxembourg), Rest of Europe)
  • Asia Pacific (China, Japan, India, New Zealand, Australia, South Korea, Southeast Asia (Indonesia, Thailand, Malaysia, Singapore, Rest of Southeast Asia), Rest of Asia Pacific)
  • Middle East & Africa (Saudi Arabia, UAE, Egypt, Kuwait, South Africa, Rest of Middle East & Africa)
  • Latin America (Brazil, Argentina, Rest of Latin America)

Table of Contents

.

1.Market Scope
1.1.Market Segmentation

1.2.Years Considered
1.2.1.Historic Years: 2015 – 2021

1.2.2.Base Year: 2022

1.2.3.Forecast Years: 2023 – 2031

2.Key Target Audiences

3.Research Methodology
3.1.Primary Research
3.1.1.Research Questionnaire

3.1.2.Global Percentage Breakdown

3.1.3.Primary Interviews: Key Opinion Leaders (KOLs)

3.2.Secondary Research
3.2.1.Paid Databases

3.2.2.Secondary Sources

3.3.Market Size Estimates
3.3.1.Top-Down Approach

3.3.2.Bottom-Up Approach

3.4.Data Triangulation Methodology

3.5.Research Assumptions

4.Recommendations and Insights from TNR’s Perspective**

5.Holistic Overview of Neurological Biomarkers Market

6.Market Synopsis: Neurological Biomarkers Market

7.Neurological Biomarkers Market Analysis: Qualitative Perspective
7.1.Introduction
7.1.1.Product Definition

7.1.2.Industry Development

7.2.Market Dynamics
7.2.1.Drivers

7.2.2.Restraints

7.2.3.Opportunities

7.2.4.Challenges

7.3.Trends in Neurological Biomarkers Market

7.4.Market Determinants Radar Chart

7.5.Macro-Economic and Micro-Economic Indicators: Neurological Biomarkers Market

7.6.Impact of Covid-19 on Neurological Biomarkers Market

8.Global Neurological Biomarkers Market Analysis and Forecasts, 2023 – 2031
8.1.Overview
8.1.1.Global Neurological Biomarkers Market Revenue (US$ Mn)

8.2.Global Neurological Biomarkers Market Revenue (US$ Mn) and Forecasts, By Type
8.2.1.Genomic
8.2.1.1.Definition

8.2.1.2.Market Estimation and Penetration, 2015 – 2022

8.2.1.3.Market Forecast, 2023 – 2031

8.2.1.4.Compound Annual Growth Rate (CAGR)

8.2.1.5.Regional Bifurcation
8.2.1.5.1.North America
8.2.1.5.1.1.Market Estimation, 2015 – 2022

8.2.1.5.1.2.Market Forecast, 2023 – 2031

8.2.1.5.2.Europe
8.2.1.5.2.1.Market Estimation, 2015 – 2022

8.2.1.5.2.2.Market Forecast, 2023 – 2031

8.2.1.5.3.Asia Pacific
8.2.1.5.3.1.Market Estimation, 2015 – 2022

8.2.1.5.3.2.Market Forecast, 2023 – 2031

8.2.1.5.4.Middle East and Africa
8.2.1.5.4.1.Market Estimation, 2015 – 2022

8.2.1.5.4.2.Market Forecast, 2023 – 2031

8.2.1.5.5.Latin America
8.2.1.5.5.1.Market Estimation, 2015 – 2022

8.2.1.5.5.2.Market Forecast, 2023 – 2031

8.2.2.Proteomic
8.2.2.1.Definition

8.2.2.2.Market Estimation and Penetration, 2015 – 2022

8.2.2.3.Market Forecast, 2023 – 2031

8.2.2.4.Compound Annual Growth Rate (CAGR)

8.2.2.5.Regional Bifurcation
8.2.2.5.1.North America
8.2.2.5.1.1.Market Estimation, 2015 – 2022

8.2.2.5.1.2.Market Forecast, 2023 – 2031

8.2.2.5.2.Europe
8.2.2.5.2.1.Market Estimation, 2015 – 2022

8.2.2.5.2.2.Market Forecast, 2023 – 2031

8.2.2.5.3.Asia Pacific
8.2.2.5.3.1.Market Estimation, 2015 – 2022

8.2.2.5.3.2.Market Forecast, 2023 – 2031

8.2.2.5.4.Middle East and Africa
8.2.2.5.4.1.Market Estimation, 2015 – 2022

8.2.2.5.4.2.Market Forecast, 2023 – 2031

8.2.2.5.5.Latin America
8.2.2.5.5.1.Market Estimation, 2015 – 2022

8.2.2.5.5.2.Market Forecast, 2023 – 2031

8.2.3.Metabolomic
8.2.3.1.Definition

8.2.3.2.Market Estimation and Penetration, 2015 – 2022

8.2.3.3.Market Forecast, 2023 – 2031

8.2.3.4.Compound Annual Growth Rate (CAGR)

8.2.3.5.Regional Bifurcation
8.2.3.5.1.North America
8.2.3.5.1.1.Market Estimation, 2015 – 2022

8.2.3.5.1.2.Market Forecast, 2023 – 2031

8.2.3.5.2.Europe
8.2.3.5.2.1.Market Estimation, 2015 – 2022

8.2.3.5.2.2.Market Forecast, 2023 – 2031

8.2.3.5.3.Asia Pacific
8.2.3.5.3.1.Market Estimation, 2015 – 2022

8.2.3.5.3.2.Market Forecast, 2023 – 2031

8.2.3.5.4.Middle East and Africa
8.2.3.5.4.1.Market Estimation, 2015 – 2022

8.2.3.5.4.2.Market Forecast, 2023 – 2031

8.2.3.5.5.Latin America
8.2.3.5.5.1.Market Estimation, 2015 – 2022

8.2.3.5.5.2.Market Forecast, 2023 – 2031

8.2.4.Imaging
8.2.4.1.Definition

8.2.4.2.Market Estimation and Penetration, 2015 – 2022

8.2.4.3.Market Forecast, 2023 – 2031

8.2.4.4.Compound Annual Growth Rate (CAGR)

8.2.4.5.Regional Bifurcation
8.2.4.5.1.North America
8.2.4.5.1.1.Market Estimation, 2015 – 2022

8.2.4.5.1.2.Market Forecast, 2023 – 2031

8.2.4.5.2.Europe
8.2.4.5.2.1.Market Estimation, 2015 – 2022

8.2.4.5.2.2.Market Forecast, 2023 – 2031

8.2.4.5.3.Asia Pacific
8.2.4.5.3.1.Market Estimation, 2015 – 2022

8.2.4.5.3.2.Market Forecast, 2023 – 2031

8.2.4.5.4.Middle East and Africa
8.2.4.5.4.1.Market Estimation, 2015 – 2022

8.2.4.5.4.2.Market Forecast, 2023 – 2031

8.2.4.5.5.Latin America
8.2.4.5.5.1.Market Estimation, 2015 – 2022

8.2.4.5.5.2.Market Forecast, 2023 – 2031

8.2.5.Others
8.2.5.1.Definition

8.2.5.2.Market Estimation and Penetration, 2015 – 2022

8.2.5.3.Market Forecast, 2023 – 2031

8.2.5.4.Compound Annual Growth Rate (CAGR)

8.2.5.5.Regional Bifurcation
8.2.5.5.1.North America
8.2.5.5.1.1.Market Estimation, 2015 – 2022

8.2.5.5.1.2.Market Forecast, 2023 – 2031

8.2.5.5.2.Europe
8.2.5.5.2.1.Market Estimation, 2015 – 2022

8.2.5.5.2.2.Market Forecast, 2023 – 2031

8.2.5.5.3.Asia Pacific
8.2.5.5.3.1.Market Estimation, 2015 – 2022

8.2.5.5.3.2.Market Forecast, 2023 – 2031

8.2.5.5.4.Middle East and Africa
8.2.5.5.4.1.Market Estimation, 2015 – 2022

8.2.5.5.4.2.Market Forecast, 2023 – 2031

8.2.5.5.5.Latin America
8.2.5.5.5.1.Market Estimation, 2015 – 2022

8.2.5.5.5.2.Market Forecast, 2023 – 2031

8.3.Key Segment for Channeling Investments
8.3.1.By Type

9.Global Neurological Biomarkers Market Analysis and Forecasts, 2023 – 2031
9.1.Overview

9.2.Global Neurological Biomarkers Market Revenue (US$ Mn) and Forecasts, By Application
9.2.1.Alzheimer’s Disease
9.2.1.1.Definition

9.2.1.2.Market Estimation and Penetration, 2015 – 2022

9.2.1.3.Market Forecast, 2023 – 2031

9.2.1.4.Compound Annual Growth Rate (CAGR)

9.2.1.5.Regional Bifurcation
9.2.1.5.1.North America
9.2.1.5.1.1.Market Estimation, 2015 – 2022

9.2.1.5.1.2.Market Forecast, 2023 – 2031

9.2.1.5.2.Europe
9.2.1.5.2.1.Market Estimation, 2015 – 2022

9.2.1.5.2.2.Market Forecast, 2023 – 2031

9.2.1.5.3.Asia Pacific
9.2.1.5.3.1.Market Estimation, 2015 – 2022

9.2.1.5.3.2.Market Forecast, 2023 – 2031

9.2.1.5.4.Middle East and Africa
9.2.1.5.4.1.Market Estimation, 2015 – 2022

9.2.1.5.4.2.Market Forecast, 2023 – 2031

9.2.1.5.5.Latin America
9.2.1.5.5.1.Market Estimation, 2015 – 2022

9.2.1.5.5.2.Market Forecast, 2023 – 2031

9.2.2.Parkinson’s Disease
9.2.2.1.Definition

9.2.2.2.Market Estimation and Penetration, 2015 – 2022

9.2.2.3.Market Forecast, 2023 – 2031

9.2.2.4.Compound Annual Growth Rate (CAGR)

9.2.2.5.Regional Bifurcation
9.2.2.5.1.North America
9.2.2.5.1.1.Market Estimation, 2015 – 2022

9.2.2.5.1.2.Market Forecast, 2023 – 2031

9.2.2.5.2.Europe
9.2.2.5.2.1.Market Estimation, 2015 – 2022

9.2.2.5.2.2.Market Forecast, 2023 – 2031

9.2.2.5.3.Asia Pacific
9.2.2.5.3.1.Market Estimation, 2015 – 2022

9.2.2.5.3.2.Market Forecast, 2023 – 2031

9.2.2.5.4.Middle East and Africa
9.2.2.5.4.1.Market Estimation, 2015 – 2022

9.2.2.5.4.2.Market Forecast, 2023 – 2031

9.2.2.5.5.Latin America
9.2.2.5.5.1.Market Estimation, 2015 – 2022

9.2.2.5.5.2.Market Forecast, 2023 – 2031

9.2.3.Multiple Sclerosis
9.2.3.1.Definition

9.2.3.2.Market Estimation and Penetration, 2015 – 2022

9.2.3.3.Market Forecast, 2023 – 2031

9.2.3.4.Compound Annual Growth Rate (CAGR)

9.2.3.5.Regional Bifurcation
9.2.3.5.1.North America
9.2.3.5.1.1.Market Estimation, 2015 – 2022

9.2.3.5.1.2.Market Forecast, 2023 – 2031

9.2.3.5.2.Europe
9.2.3.5.2.1.Market Estimation, 2015 – 2022

9.2.3.5.2.2.Market Forecast, 2023 – 2031

9.2.3.5.3.Asia Pacific
9.2.3.5.3.1.Market Estimation, 2015 – 2022

9.2.3.5.3.2.Market Forecast, 2023 – 2031

9.2.3.5.4.Middle East and Africa
9.2.3.5.4.1.Market Estimation, 2015 – 2022

9.2.3.5.4.2.Market Forecast, 2023 – 2031

9.2.3.5.5.Latin America
9.2.3.5.5.1.Market Estimation, 2015 – 2022

9.2.3.5.5.2.Market Forecast, 2023 – 2031

9.2.4.Autism Spectrum Disorder
9.2.4.1.Definition

9.2.4.2.Market Estimation and Penetration, 2015 – 2022

9.2.4.3.Market Forecast, 2023 – 2031

9.2.4.4.Compound Annual Growth Rate (CAGR)

9.2.4.5.Regional Bifurcation
9.2.4.5.1.North America
9.2.4.5.1.1.Market Estimation, 2015 – 2022

9.2.4.5.1.2.Market Forecast, 2023 – 2031

9.2.4.5.2.Europe
9.2.4.5.2.1.Market Estimation, 2015 – 2022

9.2.4.5.2.2.Market Forecast, 2023 – 2031

9.2.4.5.3.Asia Pacific
9.2.4.5.3.1.Market Estimation, 2015 – 2022

9.2.4.5.3.2.Market Forecast, 2023 – 2031

9.2.4.5.4.Middle East and Africa
9.2.4.5.4.1.Market Estimation, 2015 – 2022

9.2.4.5.4.2.Market Forecast, 2023 – 2031

9.2.4.5.5.Latin America
9.2.4.5.5.1.Market Estimation, 2015 – 2022

9.2.4.5.5.2.Market Forecast, 2023 – 2031

9.2.5.Others
9.2.5.1.Definition

9.2.5.2.Market Estimation and Penetration, 2015 – 2022

9.2.5.3.Market Forecast, 2023 – 2031

9.2.5.4.Compound Annual Growth Rate (CAGR)

9.2.5.5.Regional Bifurcation
9.2.5.5.1.North America
9.2.5.5.1.1.Market Estimation, 2015 – 2022

9.2.5.5.1.2.Market Forecast, 2023 – 2031

9.2.5.5.2.Europe
9.2.5.5.2.1.Market Estimation, 2015 – 2022

9.2.5.5.2.2.Market Forecast, 2023 – 2031

9.2.5.5.3.Asia Pacific
9.2.5.5.3.1.Market Estimation, 2015 – 2022

9.2.5.5.3.2.Market Forecast, 2023 – 2031

9.2.5.5.4.Middle East and Africa
9.2.5.5.4.1.Market Estimation, 2015 – 2022

9.2.5.5.4.2.Market Forecast, 2023 – 2031

9.2.5.5.5.Latin America
9.2.5.5.5.1.Market Estimation, 2015 – 2022

9.2.5.5.5.2.Market Forecast, 2023 – 2031

9.3.Key Segment for Channeling Investments
9.3.1.By Application

10.Global Neurological Biomarkers Market Analysis and Forecasts, 2023 – 2031
10.1.Overview

10.2.Global Neurological Biomarkers Market Revenue (US$ Mn) and Forecasts, By End Use
10.2.1.Hospital and Hospital Laboratories
10.2.1.1.Definition

10.2.1.2.Market Estimation and Penetration, 2015 – 2022

10.2.1.3.Market Forecast, 2023 – 2031

10.2.1.4.Compound Annual Growth Rate (CAGR)

10.2.1.5.Regional Bifurcation
10.2.1.5.1.North America
10.2.1.5.1.1.Market Estimation, 2015 – 2022

10.2.1.5.1.2.Market Forecast, 2023 – 2031

10.2.1.5.2.Europe
10.2.1.5.2.1.Market Estimation, 2015 – 2022

10.2.1.5.2.2.Market Forecast, 2023 – 2031

10.2.1.5.3.Asia Pacific
10.2.1.5.3.1.Market Estimation, 2015 – 2022

10.2.1.5.3.2.Market Forecast, 2023 – 2031

10.2.1.5.4.Middle East and Africa
10.2.1.5.4.1.Market Estimation, 2015 – 2022

10.2.1.5.4.2.Market Forecast, 2023 – 2031

10.2.1.5.5.Latin America
10.2.1.5.5.1.Market Estimation, 2015 – 2022

10.2.1.5.5.2.Market Forecast, 2023 – 2031

10.2.2.Independent Clinical Diagnostic Centers
10.2.2.1.Definition

10.2.2.2.Market Estimation and Penetration, 2015 – 2022

10.2.2.3.Market Forecast, 2023 – 2031

10.2.2.4.Compound Annual Growth Rate (CAGR)

10.2.2.5.Regional Bifurcation
10.2.2.5.1.North America
10.2.2.5.1.1.Market Estimation, 2015 – 2022

10.2.2.5.1.2.Market Forecast, 2023 – 2031

10.2.2.5.2.Europe
10.2.2.5.2.1.Market Estimation, 2015 – 2022

10.2.2.5.2.2.Market Forecast, 2023 – 2031

10.2.2.5.3.Asia Pacific
10.2.2.5.3.1.Market Estimation, 2015 – 2022

10.2.2.5.3.2.Market Forecast, 2023 – 2031

10.2.2.5.4.Middle East and Africa
10.2.2.5.4.1.Market Estimation, 2015 – 2022

10.2.2.5.4.2.Market Forecast, 2023 – 2031

10.2.2.5.5.Latin America
10.2.2.5.5.1.Market Estimation, 2015 – 2022

10.2.2.5.5.2.Market Forecast, 2023 – 2031

10.2.3.Research Organizations and Others
10.2.3.1.Definition

10.2.3.2.Market Estimation and Penetration, 2015 – 2022

10.2.3.3.Market Forecast, 2023 – 2031

10.2.3.4.Compound Annual Growth Rate (CAGR)

10.2.3.5.Regional Bifurcation
10.2.3.5.1.North America
10.2.3.5.1.1.Market Estimation, 2015 – 2022

10.2.3.5.1.2.Market Forecast, 2023 – 2031

10.2.3.5.2.Europe
10.2.3.5.2.1.Market Estimation, 2015 – 2022

10.2.3.5.2.2.Market Forecast, 2023 – 2031

10.2.3.5.3.Asia Pacific
10.2.3.5.3.1.Market Estimation, 2015 – 2022

10.2.3.5.3.2.Market Forecast, 2023 – 2031

10.2.3.5.4.Middle East and Africa
10.2.3.5.4.1.Market Estimation, 2015 – 2022

10.2.3.5.4.2.Market Forecast, 2023 – 2031

10.2.3.5.5.Latin America
10.2.3.5.5.1.Market Estimation, 2015 – 2022

10.2.3.5.5.2.Market Forecast, 2023 – 2031

10.3.Key Segment for Channeling Investments
10.3.1.By End Use

11.North America Neurological Biomarkers Market Analysis and Forecasts, 2023 – 2031
11.1.Overview
11.1.1.North America Neurological Biomarkers Market Revenue (US$ Mn)

11.2.North America Neurological Biomarkers Market Revenue (US$ Mn) and Forecasts, By Type
11.2.1.Genomic

11.2.2.Proteomic

11.2.3.Metabolomic

11.2.4.Imaging

11.2.5.Others

11.3.North America Neurological Biomarkers Market Revenue (US$ Mn) and Forecasts, By Application
11.3.1.Alzheimer’s Disease

11.3.2.Parkinson’s Disease

11.3.3.Multiple Sclerosis

11.3.4.Autism Spectrum Disorder

11.3.5.Others

11.4.North America Neurological Biomarkers Market Revenue (US$ Mn) and Forecasts, By End Use
11.4.1.Hospital and Hospital Laboratories

11.4.2.Independent Clinical Diagnostic Centers

11.4.3.Research Organizations and Others

11.5.North America Neurological Biomarkers Market Revenue (US$ Mn) and Forecasts, By Country
11.5.1.U.S
11.5.1.1.U.S Neurological Biomarkers Market Revenue (US$ Mn) and Forecasts, By Type
11.5.1.1.1.Genomic

11.5.1.1.2.Proteomic

11.5.1.1.3.Metabolomic

11.5.1.1.4.Imaging

11.5.1.1.5.Others

11.5.1.2.U.S Neurological Biomarkers Market Revenue (US$ Mn) and Forecasts, By Application
11.5.1.2.1.Alzheimer’s Disease

11.5.1.2.2.Parkinson’s Disease

11.5.1.2.3.Multiple Sclerosis

11.5.1.2.4.Autism Spectrum Disorder

11.5.1.2.5.Others

11.5.1.3.U.S Neurological Biomarkers Market Revenue (US$ Mn) and Forecasts, By End Use
11.5.1.3.1.Hospital and Hospital Laboratories

11.5.1.3.2.Independent Clinical Diagnostic Centers

11.5.1.3.3.Research Organizations and Others

11.5.2.Canada
11.5.2.1.Canada Neurological Biomarkers Market Revenue (US$ Mn) and Forecasts, By Type
11.5.2.1.1.Genomic

11.5.2.1.2.Proteomic

11.5.2.1.3.Metabolomic

11.5.2.1.4.Imaging

11.5.2.1.5.Others

11.5.2.2.Canada Neurological Biomarkers Market Revenue (US$ Mn) and Forecasts, By Application
11.5.2.2.1.Alzheimer’s Disease

11.5.2.2.2.Parkinson’s Disease

11.5.2.2.3.Multiple Sclerosis

11.5.2.2.4.Autism Spectrum Disorder

11.5.2.2.5.Others

11.5.2.3.Canada Neurological Biomarkers Market Revenue (US$ Mn) and Forecasts, By End Use
11.5.2.3.1.Hospital and Hospital Laboratories

11.5.2.3.2.Independent Clinical Diagnostic Centers

11.5.2.3.3.Research Organizations and Others

11.5.3.Mexico
11.5.3.1.Mexico Neurological Biomarkers Market Revenue (US$ Mn) and Forecasts, By Type
11.5.3.1.1.Genomic

11.5.3.1.2.Proteomic

11.5.3.1.3.Metabolomic

11.5.3.1.4.Imaging

11.5.3.1.5.Others

11.5.3.2.Mexico Neurological Biomarkers Market Revenue (US$ Mn) and Forecasts, By Application
11.5.3.2.1.Alzheimer’s Disease

11.5.3.2.2.Parkinson’s Disease

11.5.3.2.3.Multiple Sclerosis

11.5.3.2.4.Autism Spectrum Disorder

11.5.3.2.5.Others

11.5.3.3.Mexico Neurological Biomarkers Market Revenue (US$ Mn) and Forecasts, By End Use
11.5.3.3.1.Hospital and Hospital Laboratories

11.5.3.3.2.Independent Clinical Diagnostic Centers

11.5.3.3.3.Research Organizations and Others

11.5.4.Rest of North America
11.5.4.1.Rest of North America Neurological Biomarkers Market Revenue (US$ Mn) and Forecasts, By Type
11.5.4.1.1.Genomic

11.5.4.1.2.Proteomic

11.5.4.1.3.Metabolomic

11.5.4.1.4.Imaging

11.5.4.1.5.Others

11.5.4.2.Rest of North America Neurological Biomarkers Market Revenue (US$ Mn) and Forecasts, By Application
11.5.4.2.1.Alzheimer’s Disease

11.5.4.2.2.Parkinson’s Disease

11.5.4.2.3.Multiple Sclerosis

11.5.4.2.4.Autism Spectrum Disorder

11.5.4.2.5.Others

11.5.4.3.Rest of North America Neurological Biomarkers Market Revenue (US$ Mn) and Forecasts, By End Use
11.5.4.3.1.Hospital and Hospital Laboratories

11.5.4.3.2.Independent Clinical Diagnostic Centers

11.5.4.3.3.Research Organizations and Others

11.6.Key Segment for Channeling Investments
11.6.1.By Country

11.6.2.By Type

11.6.3.By Application

11.6.4.By End Use

12.Europe Neurological Biomarkers Market Analysis and Forecasts, 2023 – 2031
12.1.Overview
12.1.1.Europe Neurological Biomarkers Market Revenue (US$ Mn)

12.2.Europe Neurological Biomarkers Market Revenue (US$ Mn) and Forecasts, By Type
12.2.1.Genomic

12.2.2.Proteomic

12.2.3.Metabolomic

12.2.4.Imaging

12.2.5.Others

12.3.Europe Neurological Biomarkers Market Revenue (US$ Mn) and Forecasts, By Application
12.3.1.Alzheimer’s Disease

12.3.2.Parkinson’s Disease

12.3.3.Multiple Sclerosis

12.3.4.Autism Spectrum Disorder

12.3.5.Others

12.4.Europe Neurological Biomarkers Market Revenue (US$ Mn) and Forecasts, By End Use
12.4.1.Hospital and Hospital Laboratories

12.4.2.Independent Clinical Diagnostic Centers

12.4.3.Research Organizations and Others

12.5.Europe Neurological Biomarkers Market Revenue (US$ Mn) and Forecasts, By Country
12.5.1.France
12.5.1.1.France Neurological Biomarkers Market Revenue (US$ Mn) and Forecasts, By Type
12.5.1.1.1.Genomic

12.5.1.1.2.Proteomic

12.5.1.1.3.Metabolomic

12.5.1.1.4.Imaging

12.5.1.1.5.Others

12.5.1.2.France Neurological Biomarkers Market Revenue (US$ Mn) and Forecasts, By Application
12.5.1.2.1.Alzheimer’s Disease

12.5.1.2.2.Parkinson’s Disease

12.5.1.2.3.Multiple Sclerosis

12.5.1.2.4.Autism Spectrum Disorder

12.5.1.2.5.Others

12.5.1.3.France Neurological Biomarkers Market Revenue (US$ Mn) and Forecasts, By End Use
12.5.1.3.1.Hospital and Hospital Laboratories

12.5.1.3.2.Independent Clinical Diagnostic Centers

12.5.1.3.3.Research Organizations and Others

12.5.2.The UK
12.5.2.1.The UK Neurological Biomarkers Market Revenue (US$ Mn) and Forecasts, By Type
12.5.2.1.1.Genomic

12.5.2.1.2.Proteomic

12.5.2.1.3.Metabolomic

12.5.2.1.4.Imaging

12.5.2.1.5.Others

12.5.2.2.The UK Neurological Biomarkers Market Revenue (US$ Mn) and Forecasts, By Application
12.5.2.2.1.Alzheimer’s Disease

12.5.2.2.2.Parkinson’s Disease

12.5.2.2.3.Multiple Sclerosis

12.5.2.2.4.Autism Spectrum Disorder

12.5.2.2.5.Others

12.5.2.3.The UK Neurological Biomarkers Market Revenue (US$ Mn) and Forecasts, By End Use
12.5.2.3.1.Hospital and Hospital Laboratories

12.5.2.3.2.Independent Clinical Diagnostic Centers

12.5.2.3.3.Research Organizations and Others

12.5.3.Spain
12.5.3.1.Spain Neurological Biomarkers Market Revenue (US$ Mn) and Forecasts, By Type
12.5.3.1.1.Genomic

12.5.3.1.2.Proteomic

12.5.3.1.3.Metabolomic

12.5.3.1.4.Imaging

12.5.3.1.5.Others

12.5.3.2.Spain Neurological Biomarkers Market Revenue (US$ Mn) and Forecasts, By Application
12.5.3.2.1.Alzheimer’s Disease

12.5.3.2.2.Parkinson’s Disease

12.5.3.2.3.Multiple Sclerosis

12.5.3.2.4.Autism Spectrum Disorder

12.5.3.2.5.Others

12.5.3.3.Spain Neurological Biomarkers Market Revenue (US$ Mn) and Forecasts, By End Use
12.5.3.3.1.Hospital and Hospital Laboratories

12.5.3.3.2.Independent Clinical Diagnostic Centers

12.5.3.3.3.Research Organizations and Others

12.5.4.Germany
12.5.4.1.Germany Neurological Biomarkers Market Revenue (US$ Mn) and Forecasts, By Type
12.5.4.1.1.Genomic

12.5.4.1.2.Proteomic

12.5.4.1.3.Metabolomic

12.5.4.1.4.Imaging

12.5.4.1.5.Others

12.5.4.2.Germany Neurological Biomarkers Market Revenue (US$ Mn) and Forecasts, By Application
12.5.4.2.1.Alzheimer’s Disease

12.5.4.2.2.Parkinson’s Disease

12.5.4.2.3.Multiple Sclerosis

12.5.4.2.4.Autism Spectrum Disorder

12.5.4.2.5.Others

12.5.4.3.Germany Neurological Biomarkers Market Revenue (US$ Mn) and Forecasts, By End Use
12.5.4.3.1.Hospital and Hospital Laboratories

12.5.4.3.2.Independent Clinical Diagnostic Centers

12.5.4.3.3.Research Organizations and Others

12.5.5.Italy
12.5.5.1.Italy Neurological Biomarkers Market Revenue (US$ Mn) and Forecasts, By Type
12.5.5.1.1.Genomic

12.5.5.1.2.Proteomic

12.5.5.1.3.Metabolomic

12.5.5.1.4.Imaging

12.5.5.1.5.Others

12.5.5.2.Italy Neurological Biomarkers Market Revenue (US$ Mn) and Forecasts, By Application
12.5.5.2.1.Alzheimer’s Disease

12.5.5.2.2.Parkinson’s Disease

12.5.5.2.3.Multiple Sclerosis

12.5.5.2.4.Autism Spectrum Disorder

12.5.5.2.5.Others

12.5.5.3.Italy Neurological Biomarkers Market Revenue (US$ Mn) and Forecasts, By End Use
12.5.5.3.1.Hospital and Hospital Laboratories

12.5.5.3.2.Independent Clinical Diagnostic Centers

12.5.5.3.3.Research Organizations and Others

12.5.6.Nordic Countries
12.5.6.1.Nordic Countries Neurological Biomarkers Market Revenue (US$ Mn) and Forecasts, By Type
12.5.6.1.1.Genomic

12.5.6.1.2.Proteomic

12.5.6.1.3.Metabolomic

12.5.6.1.4.Imaging

12.5.6.1.5.Others

12.5.6.2.Nordic Countries Neurological Biomarkers Market Revenue (US$ Mn) and Forecasts, By Application
12.5.6.2.1.Alzheimer’s Disease

12.5.6.2.2.Parkinson’s Disease

12.5.6.2.3.Multiple Sclerosis

12.5.6.2.4.Autism Spectrum Disorder

12.5.6.2.5.Others

12.5.6.3.Nordic Countries Neurological Biomarkers Market Revenue (US$ Mn) and Forecasts, By End Use
12.5.6.3.1.Hospital and Hospital Laboratories

12.5.6.3.2.Independent Clinical Diagnostic Centers

12.5.6.3.3.Research Organizations and Others

12.5.6.4.Nordic Countries Neurological Biomarkers Market Revenue (US$ Mn) and Forecasts, By Country
12.5.6.4.1.Denmark

12.5.6.4.2.Finland

12.5.6.4.3.Iceland

12.5.6.4.4.Sweden

12.5.6.4.5.Norway

12.5.7.Benelux Union
12.5.7.1.Benelux Union Neurological Biomarkers Market Revenue (US$ Mn) and Forecasts, By Type
12.5.7.1.1.Genomic

12.5.7.1.2.Proteomic

12.5.7.1.3.Metabolomic

12.5.7.1.4.Imaging

12.5.7.1.5.Others

12.5.7.2.Benelux Union Neurological Biomarkers Market Revenue (US$ Mn) and Forecasts, By Application
12.5.7.2.1.Alzheimer’s Disease

12.5.7.2.2.Parkinson’s Disease

12.5.7.2.3.Multiple Sclerosis

12.5.7.2.4.Autism Spectrum Disorder

12.5.7.2.5.Others

12.5.7.3.Benelux Union Neurological Biomarkers Market Revenue (US$ Mn) and Forecasts, By End Use
12.5.7.3.1.Hospital and Hospital Laboratories

12.5.7.3.2.Independent Clinical Diagnostic Centers

12.5.7.3.3.Research Organizations and Others

12.5.7.4.Benelux Union Neurological Biomarkers Market Revenue (US$ Mn) and Forecasts, By Country
12.5.7.4.1.Belgium

12.5.7.4.2.The Netherlands

12.5.7.4.3.Luxembourg

12.5.8.Rest of Europe
12.5.8.1.Rest of Europe Neurological Biomarkers Market Revenue (US$ Mn) and Forecasts, By Type
12.5.8.1.1.Genomic

12.5.8.1.2.Proteomic

12.5.8.1.3.Metabolomic

12.5.8.1.4.Imaging

12.5.8.1.5.Others

12.5.8.2.Rest of Europe Neurological Biomarkers Market Revenue (US$ Mn) and Forecasts, By Application
12.5.8.2.1.Alzheimer’s Disease

12.5.8.2.2.Parkinson’s Disease

12.5.8.2.3.Multiple Sclerosis

12.5.8.2.4.Autism Spectrum Disorder

12.5.8.2.5.Others

12.5.8.3.Rest of Europe Neurological Biomarkers Market Revenue (US$ Mn) and Forecasts, By End Use
12.5.8.3.1.Hospital and Hospital Laboratories

12.5.8.3.2.Independent Clinical Diagnostic Centers

12.5.8.3.3.Research Organizations and Others

12.6.Key Segment for Channeling Investments
12.6.1.By Country

12.6.2.By Type

12.6.3.By Application

12.6.4.By End Use

13.Asia Pacific Neurological Biomarkers Market Analysis and Forecasts, 2023 – 2031
13.1.Overview
13.1.1.Asia Pacific Neurological Biomarkers Market Revenue (US$ Mn)

13.2.Asia Pacific Neurological Biomarkers Market Revenue (US$ Mn) and Forecasts, By Type
13.2.1.Genomic

13.2.2.Proteomic

13.2.3.Metabolomic

13.2.4.Imaging

13.2.5.Others

13.3.Asia Pacific Neurological Biomarkers Market Revenue (US$ Mn) and Forecasts, By Application
13.3.1.Alzheimer’s Disease

13.3.2.Parkinson’s Disease

13.3.3.Multiple Sclerosis

13.3.4.Autism Spectrum Disorder

13.3.5.Others

13.4.Asia Pacific Neurological Biomarkers Market Revenue (US$ Mn) and Forecasts, By End Use
13.4.1.Hospital and Hospital Laboratories

13.4.2.Independent Clinical Diagnostic Centers

13.4.3.Research Organizations and Others

13.5.Asia Pacific Neurological Biomarkers Market Revenue (US$ Mn) and Forecasts, By Country
13.5.1.China
13.5.1.1.China Neurological Biomarkers Market Revenue (US$ Mn) and Forecasts, By Type
13.5.1.1.1.Genomic

13.5.1.1.2.Proteomic

13.5.1.1.3.Metabolomic

13.5.1.1.4.Imaging

13.5.1.1.5.Others

13.5.1.2.China Neurological Biomarkers Market Revenue (US$ Mn) and Forecasts, By Application
13.5.1.2.1.Alzheimer’s Disease

13.5.1.2.2.Parkinson’s Disease

13.5.1.2.3.Multiple Sclerosis

13.5.1.2.4.Autism Spectrum Disorder

13.5.1.2.5.Others

13.5.1.3.China Neurological Biomarkers Market Revenue (US$ Mn) and Forecasts, By End Use
13.5.1.3.1.Hospital and Hospital Laboratories

13.5.1.3.2.Independent Clinical Diagnostic Centers

13.5.1.3.3.Research Organizations and Others

13.5.2.Japan
13.5.2.1.Japan Neurological Biomarkers Market Revenue (US$ Mn) and Forecasts, By Type
13.5.2.1.1.Genomic

13.5.2.1.2.Proteomic

13.5.2.1.3.Metabolomic

13.5.2.1.4.Imaging

13.5.2.1.5.Others

13.5.2.2.Japan Neurological Biomarkers Market Revenue (US$ Mn) and Forecasts, By Application
13.5.2.2.1.Alzheimer’s Disease

13.5.2.2.2.Parkinson’s Disease

13.5.2.2.3.Multiple Sclerosis

13.5.2.2.4.Autism Spectrum Disorder

13.5.2.2.5.Others

13.5.2.3.Japan Neurological Biomarkers Market Revenue (US$ Mn) and Forecasts, By End Use
13.5.2.3.1.Hospital and Hospital Laboratories

13.5.2.3.2.Independent Clinical Diagnostic Centers

13.5.2.3.3.Research Organizations and Others

13.5.3.India
13.5.3.1.India Neurological Biomarkers Market Revenue (US$ Mn) and Forecasts, By Type
13.5.3.1.1.Genomic

13.5.3.1.2.Proteomic

13.5.3.1.3.Metabolomic

13.5.3.1.4.Imaging

13.5.3.1.5.Others

13.5.3.2.India Neurological Biomarkers Market Revenue (US$ Mn) and Forecasts, By Application
13.5.3.2.1.Alzheimer’s Disease

13.5.3.2.2.Parkinson’s Disease

13.5.3.2.3.Multiple Sclerosis

13.5.3.2.4.Autism Spectrum Disorder

13.5.3.2.5.Others

13.5.3.3.India Neurological Biomarkers Market Revenue (US$ Mn) and Forecasts, By End Use
13.5.3.3.1.Hospital and Hospital Laboratories

13.5.3.3.2.Independent Clinical Diagnostic Centers

13.5.3.3.3.Research Organizations and Others

13.5.4.New Zealand
13.5.4.1.New Zealand Neurological Biomarkers Market Revenue (US$ Mn) and Forecasts, By Type
13.5.4.1.1.Genomic

13.5.4.1.2.Proteomic

13.5.4.1.3.Metabolomic

13.5.4.1.4.Imaging

13.5.4.1.5.Others

13.5.4.2.New Zealand Neurological Biomarkers Market Revenue (US$ Mn) and Forecasts, By Application
13.5.4.2.1.Alzheimer’s Disease

13.5.4.2.2.Parkinson’s Disease

13.5.4.2.3.Multiple Sclerosis

13.5.4.2.4.Autism Spectrum Disorder

13.5.4.2.5.Others

13.5.4.3.New Zealand Neurological Biomarkers Market Revenue (US$ Mn) and Forecasts, By End Use
13.5.4.3.1.Hospital and Hospital Laboratories

13.5.4.3.2.Independent Clinical Diagnostic Centers

13.5.4.3.3.Research Organizations and Others

13.5.5.Australia
13.5.5.1.Australia Neurological Biomarkers Market Revenue (US$ Mn) and Forecasts, By Type
13.5.5.1.1.Genomic

13.5.5.1.2.Proteomic

13.5.5.1.3.Metabolomic

13.5.5.1.4.Imaging

13.5.5.1.5.Others

13.5.5.2.Australia Neurological Biomarkers Market Revenue (US$ Mn) and Forecasts, By Application
13.5.5.2.1.Alzheimer’s Disease

13.5.5.2.2.Parkinson’s Disease

13.5.5.2.3.Multiple Sclerosis

13.5.5.2.4.Autism Spectrum Disorder

13.5.5.2.5.Others

13.5.5.3.Australia Neurological Biomarkers Market Revenue (US$ Mn) and Forecasts, By End Use
13.5.5.3.1.Hospital and Hospital Laboratories

13.5.5.3.2.Independent Clinical Diagnostic Centers

13.5.5.3.3.Research Organizations and Others

13.5.6.South Korea
13.5.6.1.South Korea Neurological Biomarkers Market Revenue (US$ Mn) and Forecasts, By Type
13.5.6.1.1.Genomic

13.5.6.1.2.Proteomic

13.5.6.1.3.Metabolomic

13.5.6.1.4.Imaging

13.5.6.1.5.Others

13.5.6.2.South Korea Neurological Biomarkers Market Revenue (US$ Mn) and Forecasts, By Application
13.5.6.2.1.Alzheimer’s Disease

13.5.6.2.2.Parkinson’s Disease

13.5.6.2.3.Multiple Sclerosis

13.5.6.2.4.Autism Spectrum Disorder

13.5.6.2.5.Others

13.5.6.3.South Korea Neurological Biomarkers Market Revenue (US$ Mn) and Forecasts, By End Use
13.5.6.3.1.Hospital and Hospital Laboratories

13.5.6.3.2.Independent Clinical Diagnostic Centers

13.5.6.3.3.Research Organizations and Others

13.5.7.Southeast Asia
13.5.7.1.Southeast Asia Neurological Biomarkers Market Revenue (US$ Mn) and Forecasts, By Type
13.5.7.1.1.Genomic

13.5.7.1.2.Proteomic

13.5.7.1.3.Metabolomic

13.5.7.1.4.Imaging

13.5.7.1.5.Others

13.5.7.2.Southeast Asia Neurological Biomarkers Market Revenue (US$ Mn) and Forecasts, By Application
13.5.7.2.1.Alzheimer’s Disease

13.5.7.2.2.Parkinson’s Disease

13.5.7.2.3.Multiple Sclerosis

13.5.7.2.4.Autism Spectrum Disorder

13.5.7.2.5.Others

13.5.7.3.Southeast Asia Neurological Biomarkers Market Revenue (US$ Mn) and Forecasts, By End Use
13.5.7.3.1.Hospital and Hospital Laboratories

13.5.7.3.2.Independent Clinical Diagnostic Centers

13.5.7.3.3.Research Organizations and Others

13.5.7.4.Southeast Asia Neurological Biomarkers Market Revenue (US$ Mn) and Forecasts, By Country
13.5.7.4.1.Indonesia

13.5.7.4.2.Thailand

13.5.7.4.3.Malaysia

13.5.7.4.4.Singapore

13.5.7.4.5.Rest of Southeast Asia

13.5.8.Rest of Asia Pacific
13.5.8.1.Rest of Asia Pacific Neurological Biomarkers Market Revenue (US$ Mn) and Forecasts, By Type
13.5.8.1.1.Genomic

13.5.8.1.2.Proteomic

13.5.8.1.3.Metabolomic

13.5.8.1.4.Imaging

13.5.8.1.5.Others

13.5.8.2.Rest of Asia Pacific Neurological Biomarkers Market Revenue (US$ Mn) and Forecasts, By Application
13.5.8.2.1.Alzheimer’s Disease

13.5.8.2.2.Parkinson’s Disease

13.5.8.2.3.Multiple Sclerosis

13.5.8.2.4.Autism Spectrum Disorder

13.5.8.2.5.Others

13.5.8.3.Rest of Asia Pacific Neurological Biomarkers Market Revenue (US$ Mn) and Forecasts, By End Use
13.5.8.3.1.Hospital and Hospital Laboratories

13.5.8.3.2.Independent Clinical Diagnostic Centers

13.5.8.3.3.Research Organizations and Others

13.6.Key Segment for Channeling Investments
13.6.1.By Country

13.6.2.By Type

13.6.3.By Application

13.6.4.By End Use

14.Middle East and Africa Neurological Biomarkers Market Analysis and Forecasts, 2023 – 2031
14.1.Overview
14.1.1.Middle East and Africa Neurological Biomarkers Market Revenue (US$ Mn)

14.2.Middle East and Africa Neurological Biomarkers Market Revenue (US$ Mn) and Forecasts, By Type
14.2.1.Genomic

14.2.2.Proteomic

14.2.3.Metabolomic

14.2.4.Imaging

14.2.5.Others

14.3.Middle East and Africa Neurological Biomarkers Market Revenue (US$ Mn) and Forecasts, By Application
14.3.1.Alzheimer’s Disease

14.3.2.Parkinson’s Disease

14.3.3.Multiple Sclerosis

14.3.4.Autism Spectrum Disorder

14.3.5.Others

14.4.Middle East and Africa Neurological Biomarkers Market Revenue (US$ Mn) and Forecasts, By End Use
14.4.1.Hospital and Hospital Laboratories

14.4.2.Independent Clinical Diagnostic Centers

14.4.3.Research Organizations and Others

14.5.Middle East and Africa Neurological Biomarkers Market Revenue (US$ Mn) and Forecasts, By Country
14.5.1.Saudi Arabia
14.5.1.1.Saudi Arabia Neurological Biomarkers Market Revenue (US$ Mn) and Forecasts, By Type
14.5.1.1.1.Genomic

14.5.1.1.2.Proteomic

14.5.1.1.3.Metabolomic

14.5.1.1.4.Imaging

14.5.1.1.5.Others

14.5.1.2.Saudi Arabia Neurological Biomarkers Market Revenue (US$ Mn) and Forecasts, By Application
14.5.1.2.1.Alzheimer’s Disease

14.5.1.2.2.Parkinson’s Disease

14.5.1.2.3.Multiple Sclerosis

14.5.1.2.4.Autism Spectrum Disorder

14.5.1.2.5.Others

14.5.1.3.Saudi Arabia Neurological Biomarkers Market Revenue (US$ Mn) and Forecasts, By End Use
14.5.1.3.1.Hospital and Hospital Laboratories

14.5.1.3.2.Independent Clinical Diagnostic Centers

14.5.1.3.3.Research Organizations and Others

14.5.2.UAE
14.5.2.1.UAE Neurological Biomarkers Market Revenue (US$ Mn) and Forecasts, By Type
14.5.2.1.1.Genomic

14.5.2.1.2.Proteomic

14.5.2.1.3.Metabolomic

14.5.2.1.4.Imaging

14.5.2.1.5.Others

14.5.2.2.UAE Neurological Biomarkers Market Revenue (US$ Mn) and Forecasts, By Application
14.5.2.2.1.Alzheimer’s Disease

14.5.2.2.2.Parkinson’s Disease

14.5.2.2.3.Multiple Sclerosis

14.5.2.2.4.Autism Spectrum Disorder

14.5.2.2.5.Others

14.5.2.3.UAE Neurological Biomarkers Market Revenue (US$ Mn) and Forecasts, By End Use
14.5.2.3.1.Hospital and Hospital Laboratories

14.5.2.3.2.Independent Clinical Diagnostic Centers

14.5.2.3.3.Research Organizations and Others

14.5.3.Egypt
14.5.3.1.Egypt Neurological Biomarkers Market Revenue (US$ Mn) and Forecasts, By Type
14.5.3.1.1.Genomic

14.5.3.1.2.Proteomic

14.5.3.1.3.Metabolomic

14.5.3.1.4.Imaging

14.5.3.1.5.Others

14.5.3.2.Egypt Neurological Biomarkers Market Revenue (US$ Mn) and Forecasts, By Application
14.5.3.2.1.Alzheimer’s Disease

14.5.3.2.2.Parkinson’s Disease

14.5.3.2.3.Multiple Sclerosis

14.5.3.2.4.Autism Spectrum Disorder

14.5.3.2.5.Others

14.5.3.3.Egypt Neurological Biomarkers Market Revenue (US$ Mn) and Forecasts, By End Use
14.5.3.3.1.Hospital and Hospital Laboratories

14.5.3.3.2.Independent Clinical Diagnostic Centers

14.5.3.3.3.Research Organizations and Others

14.5.4.Kuwait
14.5.4.1.Kuwait Neurological Biomarkers Market Revenue (US$ Mn) and Forecasts, By Type
14.5.4.1.1.Genomic

14.5.4.1.2.Proteomic

14.5.4.1.3.Metabolomic

14.5.4.1.4.Imaging

14.5.4.1.5.Others

14.5.4.2.Kuwait Neurological Biomarkers Market Revenue (US$ Mn) and Forecasts, By Application
14.5.4.2.1.Alzheimer’s Disease

14.5.4.2.2.Parkinson’s Disease

14.5.4.2.3.Multiple Sclerosis

14.5.4.2.4.Autism Spectrum Disorder

14.5.4.2.5.Others

14.5.4.3.Kuwait Neurological Biomarkers Market Revenue (US$ Mn) and Forecasts, By End Use
14.5.4.3.1.Hospital and Hospital Laboratories

14.5.4.3.2.Independent Clinical Diagnostic Centers

14.5.4.3.3.Research Organizations and Others

14.5.5.South Africa
14.5.5.1.South Africa Neurological Biomarkers Market Revenue (US$ Mn) and Forecasts, By Type
14.5.5.1.1.Genomic

14.5.5.1.2.Proteomic

14.5.5.1.3.Metabolomic

14.5.5.1.4.Imaging

14.5.5.1.5.Others

14.5.5.2.South Africa Neurological Biomarkers Market Revenue (US$ Mn) and Forecasts, By Application
14.5.5.2.1.Alzheimer’s Disease

14.5.5.2.2.Parkinson’s Disease

14.5.5.2.3.Multiple Sclerosis

14.5.5.2.4.Autism Spectrum Disorder

14.5.5.2.5.Others

14.5.5.3.South Africa Neurological Biomarkers Market Revenue (US$ Mn) and Forecasts, By End Use
14.5.5.3.1.Hospital and Hospital Laboratories

14.5.5.3.2.Independent Clinical Diagnostic Centers

14.5.5.3.3.Research Organizations and Others

14.5.6.Rest of Middle East & Africa
14.5.6.1.Rest of Middle East & Africa Neurological Biomarkers Market Revenue (US$ Mn) and Forecasts, By Type
14.5.6.1.1.Genomic

14.5.6.1.2.Proteomic

14.5.6.1.3.Metabolomic

14.5.6.1.4.Imaging

14.5.6.1.5.Others

14.5.6.2.Rest of Middle East & Africa Neurological Biomarkers Market Revenue (US$ Mn) and Forecasts, By Application
14.5.6.2.1.Alzheimer’s Disease

14.5.6.2.2.Parkinson’s Disease

14.5.6.2.3.Multiple Sclerosis

14.5.6.2.4.Autism Spectrum Disorder

14.5.6.2.5.Others

14.5.6.3.Rest of Middle East & Africa Neurological Biomarkers Market Revenue (US$ Mn) and Forecasts, By End Use
14.5.6.3.1.Hospital and Hospital Laboratories

14.5.6.3.2.Independent Clinical Diagnostic Centers

14.5.6.3.3.Research Organizations and Others

14.6.Key Segment for Channeling Investments
14.6.1.By Country

14.6.2.By Type

14.6.3.By Application

14.6.4.By End Use

15.Latin America Neurological Biomarkers Market Analysis and Forecasts, 2023 – 2031
15.1.Overview
15.1.1.Latin America Neurological Biomarkers Market Revenue (US$ Mn)

15.2.Latin America Neurological Biomarkers Market Revenue (US$ Mn) and Forecasts, By Type
15.2.1.Genomic

15.2.2.Proteomic

15.2.3.Metabolomic

15.2.4.Imaging

15.2.5.Others

15.3.Latin America Neurological Biomarkers Market Revenue (US$ Mn) and Forecasts, By Application
15.3.1.Alzheimer’s Disease

15.3.2.Parkinson’s Disease

15.3.3.Multiple Sclerosis

15.3.4.Autism Spectrum Disorder

15.3.5.Others

15.4.Latin America Neurological Biomarkers Market Revenue (US$ Mn) and Forecasts, By End Use
15.4.1.Hospital and Hospital Laboratories

15.4.2.Independent Clinical Diagnostic Centers

15.4.3.Research Organizations and Others

15.5.Latin America Neurological Biomarkers Market Revenue (US$ Mn) and Forecasts, By Country
15.5.1.Brazil
15.5.1.1.Brazil Neurological Biomarkers Market Revenue (US$ Mn) and Forecasts, By Type
15.5.1.1.1.Genomic

15.5.1.1.2.Proteomic

15.5.1.1.3.Metabolomic

15.5.1.1.4.Imaging

15.5.1.1.5.Others

15.5.1.2.Brazil Neurological Biomarkers Market Revenue (US$ Mn) and Forecasts, By Application
15.5.1.2.1.Alzheimer’s Disease

15.5.1.2.2.Parkinson’s Disease

15.5.1.2.3.Multiple Sclerosis

15.5.1.2.4.Autism Spectrum Disorder

15.5.1.2.5.Others

15.5.1.3.Brazil Neurological Biomarkers Market Revenue (US$ Mn) and Forecasts, By End Use
15.5.1.3.1.Hospital and Hospital Laboratories

15.5.1.3.2.Independent Clinical Diagnostic Centers

15.5.1.3.3.Research Organizations and Others

15.5.2.Argentina
15.5.2.1.Argentina Neurological Biomarkers Market Revenue (US$ Mn) and Forecasts, By Type
15.5.2.1.1.Genomic

15.5.2.1.2.Proteomic

15.5.2.1.3.Metabolomic

15.5.2.1.4.Imaging

15.5.2.1.5.Others

15.5.2.2.Argentina Neurological Biomarkers Market Revenue (US$ Mn) and Forecasts, By Application
15.5.2.2.1.Alzheimer’s Disease

15.5.2.2.2.Parkinson’s Disease

15.5.2.2.3.Multiple Sclerosis

15.5.2.2.4.Autism Spectrum Disorder

15.5.2.2.5.Others

15.5.2.3.Argentina Neurological Biomarkers Market Revenue (US$ Mn) and Forecasts, By End Use
15.5.2.3.1.Hospital and Hospital Laboratories

15.5.2.3.2.Independent Clinical Diagnostic Centers

15.5.2.3.3.Research Organizations and Others

15.5.3.Rest of Latin America
15.5.3.1.Rest of Latin America Neurological Biomarkers Market Revenue (US$ Mn) and Forecasts, By Type
15.5.3.1.1.Genomic

15.5.3.1.2.Proteomic

15.5.3.1.3.Metabolomic

15.5.3.1.4.Imaging

15.5.3.1.5.Others

15.5.3.2.Rest of Latin America Neurological Biomarkers Market Revenue (US$ Mn) and Forecasts, By Application
15.5.3.2.1.Alzheimer’s Disease

15.5.3.2.2.Parkinson’s Disease

15.5.3.2.3.Multiple Sclerosis

15.5.3.2.4.Autism Spectrum Disorder

15.5.3.2.5.Others

15.5.3.3.Rest of Latin America Neurological Biomarkers Market Revenue (US$ Mn) and Forecasts, By End Use
15.5.3.3.1.Hospital and Hospital Laboratories

15.5.3.3.2.Independent Clinical Diagnostic Centers

15.5.3.3.3.Research Organizations and Others

15.6.Key Segment for Channeling Investments
15.6.1.By Country

15.6.2.By Type

15.6.3.By Application

15.6.4.By End Use

16.Competitive Benchmarking
16.1.Market Share Analysis, 2022

16.2.Global Presence and Growth Strategies
16.2.1.Mergers and Acquisitions

16.2.2.Product Launches

16.2.3.Investments Trends

16.2.4.R&D Initiatives

17.Player Profiles
17.1.Abbott
17.1.1.Company Details

17.1.2.Company Overview

17.1.3.Product Offerings

17.1.4.Key Developments

17.1.5.Financial Analysis

17.1.6.SWOT Analysis

17.1.7.Business Strategies

17.2.BIOMERIEUX
17.2.1.Company Details

17.2.2.Company Overview

17.2.3.Product Offerings

17.2.4.Key Developments

17.2.5.Financial Analysis

17.2.6.SWOT Analysis

17.2.7.Business Strategies

17.3.Bio-Rad Laboratories, Inc.
17.3.1.Company Details

17.3.2.Company Overview

17.3.3.Product Offerings

17.3.4.Key Developments

17.3.5.Financial Analysis

17.3.6.SWOT Analysis

17.3.7.Business Strategies

17.4.Johnson & Johnson Services, Inc.
17.4.1.Company Details

17.4.2.Company Overview

17.4.3.Product Offerings

17.4.4.Key Developments

17.4.5.Financial Analysis

17.4.6.SWOT Analysis

17.4.7.Business Strategies

17.5.Merck KGaA
17.5.1.Company Details

17.5.2.Company Overview

17.5.3.Product Offerings

17.5.4.Key Developments

17.5.5.Financial Analysis

17.5.6.SWOT Analysis

17.5.7.Business Strategies

17.6.Quanterix
17.6.1.Company Details

17.6.2.Company Overview

17.6.3.Product Offerings

17.6.4.Key Developments

17.6.5.Financial Analysis

17.6.6.SWOT Analysis

17.6.7.Business Strategies

17.7.Rules-Based Medicine
17.7.1.Company Details

17.7.2.Company Overview

17.7.3.Product Offerings

17.7.4.Key Developments

17.7.5.Financial Analysis

17.7.6.SWOT Analysis

17.7.7.Business Strategies

17.8.Thermo Fisher Scientific Inc.
17.8.1.Company Details

17.8.2.Company Overview

17.8.3.Product Offerings

17.8.4.Key Developments

17.8.5.Financial Analysis

17.8.6.SWOT Analysis

17.8.7.Business Strategies

17.9.Other Market Participants

18.Key Findings

.

**Exclusive for Multi-User and Enterprise User.

.

Global Neurological Biomarkers Market Segmentation

By Type

 Genomic

 Proteomic

 Metabolomic

 Imaging

 Others

By Application

 Alzheimer’s Disease

 Parkinson’s Disease

 Multiple Sclerosis

 Autism Spectrum Disorder

 Others

By End Use

 Hospital & Hospital Laboratories

 Independent Clinical Diagnostic Centers

 Research Organizations And Others

By Region

 North America (U.S., Canada, Mexico, Rest of North America)

 Europe (France, The UK, Spain, Germany, Italy, Nordic Countries (Denmark, Finland, Iceland, Sweden, Norway), Benelux Union (Belgium, The Netherlands, Luxembourg), Rest of Europe)

 Asia Pacific (China, Japan, India, New Zealand, Australia, South Korea, Southeast Asia (Indonesia, Thailand, Malaysia, Singapore, Rest of Southeast Asia), Rest of Asia Pacific)

 Middle East & Africa (Saudi Arabia, UAE, Egypt, Kuwait, South Africa, Rest of Middle East & Africa)

 Latin America (Brazil, Argentina, Rest of Latin America)

**Note: The report covers cross-segmentation analysis by region further into countries

.

The Niche Research approach encompasses both primary and secondary research methods to provide comprehensive insights. While primary research is the cornerstone of our studies, we also incorporate secondary research sources such as company annual reports, premium industry databases, press releases, industry journals, and white papers.

Within our primary research, we actively engage with various industry stakeholders, conducting paid interviews and surveys. Our meticulous analysis extends to every market participant in major countries, allowing us to thoroughly examine their portfolios, calculate market shares, and segment revenues.

Our data collection primarily focuses on individual countries within our research scope, enabling us to estimate regional market sizes. Typically, we employ a bottom-up approach, meticulously tracking trends in different countries. We analyze growth drivers, constraints, technological innovations, and opportunities for each country, ultimately arriving at regional figures.Our process begins by examining the growth prospects of each country. Building upon these insights, we project growth and trends for the entire region. Finally, we utilize our proprietary model to refine estimations and forecasts.

Our data validation standards are integral to ensuring the reliability and accuracy of our research findings. Here’s a breakdown of our data validation processes and the stakeholders we engage with during our primary research:

  • Supply Side Analysis: We initiate a supply side analysis by directly contacting market participants, through telephonic interviews and questionnaires containing both open-ended and close-ended questions. We gather information on their portfolios, segment revenues, developments, and growth strategies.
  • Demand Side Analysis: To gain insights into adoption trends and consumer preferences, we reach out to target customers and users (non-vendors). This information forms a vital part of the qualitative analysis section of our reports, covering market dynamics, adoption trends, consumer behavior, spending patterns, and other related aspects.
  • Consultant Insights: We tap into the expertise of our partner consultants from around the world to obtain their unique viewpoints and perspectives. Their insights contribute to a well-rounded understanding of the markets under investigation.
  • In-House Validation: To ensure data accuracy and reliability, we conduct cross-validation of data points and information through our in-house team of consultants and utilize advanced data modeling tools for thorough verification.

The forecasts we provide are based on a comprehensive assessment of various factors, including:

  • Market Trends and Past Performance (Last Five Years): We accurately analyze market trends and performance data from preceding five years to identify historical patterns and understand the market’s evolution.
  • Historical Performance and Growth of Market Participants: We assess the historical performance and growth trajectories of key market participants. This analysis provides insights into the competitive landscape and individual company strategies.
  • Market Determinants Impact Analysis (Next Eight Years): We conduct a rigorous analysis of the factors that are projected to influence the market over the next eight years. This includes assessing both internal and external determinants that can shape market dynamics.
  • Drivers and Challenges for the Forecast Period:Identify the factors expected to drive market growth during the forecast period, as well as the challenges that the industry may face. This analysis aids in deriving an accurate growth rate projection.
  • New Acquisitions, Collaborations, or Partnerships: We keep a close watch on any new acquisitions, collaborations, or partnerships within the industry. These developments can have a significant impact on market dynamics and competitiveness.
  • Macro and Micro Factors Analysis:A thorough examination of both macro-level factors (e.g., economic trends, regulatory changes) and micro-level factors (e.g., technological advancements, consumer preferences) that may influence the market during the forecast period.
  • End-User Sentiment Analysis: To understand the market from the end-user perspective, we conduct sentiment analysis. This involves assessing the sentiment, preferences, and feedback of the end-users, which can provide valuable insights into market trends.
  • Perspective of Primary Participants: Insights gathered directly from primary research participants play a crucial role in shaping our forecasts. Their perspectives and experiences provide valuable qualitative data.
  • Year-on-Year Growth Trend: We utilize a year-on-year growth trend based on historical market growth and expected future trends. This helps in formulating our growth projections, aligning them with the market’s historical performance.

Research process adopted by TNR involves multiple stages, including data collection, validation, quality checks, and presentation. It’s crucial that the data and information we provide add value to your existing market understanding and expertise. We have also established partnerships with business consulting, research, and survey organizations across regions and globally to collaborate on regional analysis and data validation, ensuring the highest level of accuracy and reliability in our reports.


Procure Comprehensive Study of

Global Neurological Biomarkers Market

Online Only

  • Online Access
  • Read Only File
  • Validity 3 Months
  • Print, Copy, Paste & Download
  • PPT, Excel
  • Cost-Free Report in the Next Update
$3300
Buy Now

Single User

  • Access to One User on One System
  • Read Only File
  • Validity 6 Months
  • Limited Print,Copy, Paste
  • PPT, Excel
  • Cost-Free Report in the Next Update
$4200
Buy Now

Multi User

  • Access to Fiver Users
  • PDF File
  • Validity 1 Year
  • Upto FivePrints
  • Cost-Free Report in the Next Update
  • PPT, Excel
$6000
Buy Now

Enterprise User

  • Access to Unlimited Users
  • PDF, PPT, Excel
  • Unlimited Validity, Prints&Downloads
  • 1 Hour Cost-Free & Dedicated Analyst Support
  • 10% Cost-Free Customization
  • Cost-Free Report Update Twice in a Year
  • Recommendations for Business Strategies
  • Authorization to Quote TNR, The Niche Research
$7300
Buy Now

Library Access

  • Online Access to Content Publications
  • Access Player Profiles Online
  • Get Immediate Access to Newly Added Content
  • Acquire 12 PDF Downloads
  • Acquire 5 Excel Data Sets
  • Gain Access to 290+ PDFs of Company Profiles
  • Round-the-clock Email and Phone Assistance
  • Dashboard Usage and Trends
  • Renewal & Upgrade Assistance
  • Assessing Customization Options and Alerts for New Reports
$10788
Buy Now
*Taxes/Fees, if applicable will be added during checkout. All prices in USD

Why TNR The Niche Research?

  • Unwavering Commitment to Excellence

  • Veteran Team of Researchers

  • Accurate and Timely Insights

  • Ethical Practices and Customized Service

  • Uninterrupted Availability Around the Clock

Scroll to Top