Global Semiconductor Intellectual Property Market: By IP Core, By Type, By Model, By Application, By Region & Segmental Insights Trends and Forecast, 2024 – 2034

  • Industry: Semiconductors & Electronics
  • Report ID: TNR-110-1132
  • Number of Pages: 420
  • Table/Charts : Yes
  • June, 2024
  • Base Year : 2024
  • No. of Companies : 10+
  • No. of Countries : 29
  • Views : 10053
  • Covid Impact Covered: Yes
  • War Impact Covered: Yes
  • Formats : PDF, Excel, PPT

Semiconductor Intellectual Property (IP) refers to reusable design components or building blocks used in the creation of integrated circuits (ICs). These IP blocks are pre-designed and pre-verified, providing specific functionalities or features that can be integrated into larger chip designs. They can include cores for processors, memory controllers, interface protocols, and various other components essential for modern semiconductor devices. The use of semiconductor IP accelerates the development process, allowing companies to leverage proven technology without reinventing the wheel for each new project. This not only reduces time-to-market but also lowers development costs and risks associated with designing complex semiconductor components from scratch. In an industry characterized by rapid technological advancements and increasing complexity, semiconductor IP plays a crucial role in innovation. It enables companies to focus on differentiating their products and meeting specific market demands while ensuring reliability and performance. This strategic use of IP is fundamental to the development of cutting-edge technologies in sectors such as consumer electronics, automotive, telecommunications, and more.

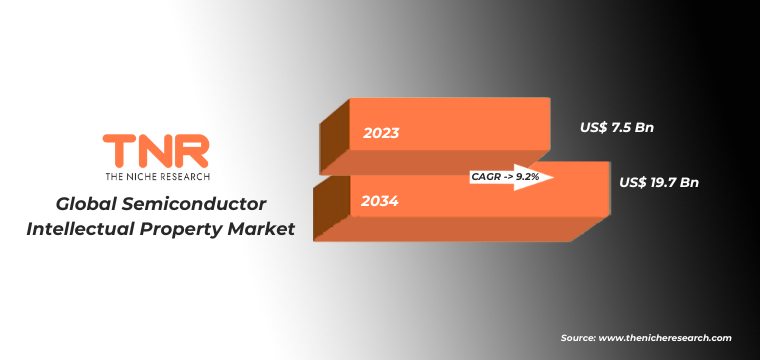
The demand for semiconductor intellectual property (IP) is driven by several critical factors that reflect the evolving needs of the technology landscape. One major driver is the rapid advancement in semiconductor technology, particularly in areas such as artificial intelligence, IoT, and 5G. These technologies require sophisticated and specialized IP blocks to ensure optimal performance and efficiency. Additionally, the increasing complexity of chip design necessitates the use of pre-verified and high-quality IP to reduce development time and costs. Companies are under pressure to bring innovative products to market quickly, and leveraging existing IP helps accelerate this process while minimizing risk. Moreover, regulatory compliance and the need for reliable, proven components drive demand for semiconductor IP, ensuring that products meet industry standards and perform reliably. These factors collectively contribute to the growing demand for semiconductor intellectual property in the market. In terms of revenue, the global semiconductor intellectual property market was worth US$ 7.5 Bn in 2023, anticipated to witness CAGR of 9.2% during 2024 – 2034.

Global Semiconductor Intellectual Property Market Dynamics

Technological Advancements: Rapid developments in technology, such as AI, IoT, and 5G, require advanced semiconductor IP to integrate new functionalities and improve performance. This drives demand for specialized and cutting-edge IP blocks. The competitive landscape of the semiconductor industry demands quicker product development cycles. Licensing semiconductor IP allows companies to accelerate time-to-market by integrating proven technologies rather than developing them from scratch.

Cost Efficiency: The high cost of R&D for developing proprietary IP motivates companies to license IP on a royalty basis, aligning expenses with revenue and reducing initial investment risks. Stringent regulations and standards in various industries, including automotive, consumer electronics, and telecommunications, drive the need for compliant semiconductor IP, ensuring safety and performance.

Consolidation and Collaboration: Mergers, acquisitions, and partnerships in the semiconductor industry led to the consolidation of IP portfolios and collaborative development efforts, enhancing the availability and diversity of semiconductor IP. Strong IP protection laws and enforcement in key markets encourage innovation and the creation of proprietary technologies, fostering a robust market for semiconductor IP licensing.

Royalty-Based Segment Has Garnered Major Market Share in the Global Semiconductor Intellectual Property Market During the Forecast Period (2024 – 2034).

The demand for royalty-based semiconductor intellectual property (IP) is driven by several key factors. One primary driver is the cost-efficiency and flexibility it offers semiconductor companies. By licensing IP on a royalty basis, companies can reduce upfront costs and align expenses with product success, making it financially viable for startups and smaller firms to access cutting-edge technology. Innovation pressure in the semiconductor industry also fuels this demand. As companies strive to integrate the latest functionalities, such as AI capabilities and advanced connectivity features, into their chips, they turn to royalty-based IP to accelerate development while minimizing risk. This model allows firms to quickly incorporate proven technologies into their designs, speeding up time-to-market and maintaining competitiveness. Additionally, the evolving complexity of semiconductor design and the push for miniaturization make it increasingly impractical for companies to develop all IP in-house. Royalty-based IP offers a solution, providing access to specialized, high-quality IP blocks without the need for extensive R&D investment. These dynamic drives the growing demand for royalty-based semiconductor intellectual property in the industry.

By Application Consumer Electronics Segment had the Highest Share in the Global Semiconductor Intellectual Property Market in 2023.

The demand for semiconductor intellectual property (IP) in the consumer electronics sector is driven by several compelling factors. The rapid evolution of consumer electronics, such as smartphones, tablets, wearables, and smart home devices, requires increasingly complex and efficient semiconductor designs. This drives the need for high-quality semiconductor IP that can deliver enhanced performance, lower power consumption, and reduced time-to-market. Innovation in areas such as artificial intelligence, augmented reality, and advanced connectivity (like 5G) also spurs demand for specialized semiconductor IP to support these technologies. Manufacturers are under constant pressure to release new products with improved features and capabilities, necessitating the use of pre-verified IP blocks to streamline the design process and ensure reliability. Additionally, consumer demand for devices with longer battery life, faster processing, and seamless connectivity pushes companies to leverage advanced semiconductor IP. This helps in optimizing power efficiency and integrating more functionalities into smaller form factors. As a result, the consumer electronics industry’s continuous quest for innovation and efficiency significantly drives the demand for semiconductor intellectual property.

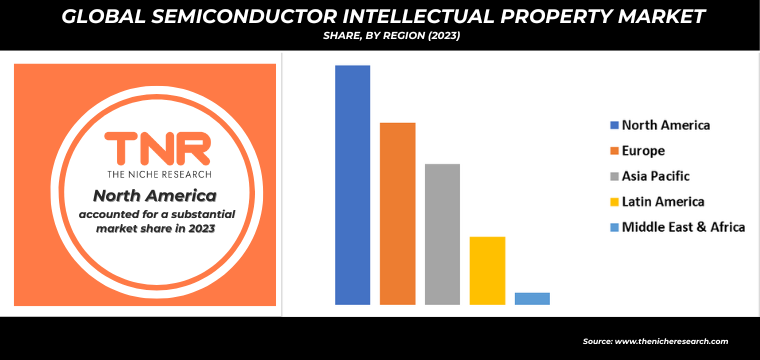
By Region North America Dominated the Semiconductor Intellectual Property Market in 2023.

In North America, the demand for semiconductor intellectual property (IP) is driven by several key factors. The rapid advancement in technology and the push towards smaller, more efficient, and more powerful electronic devices necessitate the use of sophisticated semiconductor IP. This demand is particularly strong in sectors such as consumer electronics, automotive, and telecommunications, where the need for advanced integrated circuits and efficient power management is critical. Additionally, the proliferation of IoT devices and the rise of 5G technology are significant demand drivers. These technologies require highly specialized semiconductor IP to ensure optimal performance, connectivity, and power efficiency. The increasing complexity of chip design and the need for shorter time-to-market further fuel the demand for reliable and pre-verified semiconductor IP blocks. Moreover, the North American market’s emphasis on innovation and the strong presence of major semiconductor companies and startups contribute to the growing demand. This environment fosters continuous development and integration of cutting-edge semiconductor IP to maintain competitive advantages and meet evolving technological needs.

Competitive Landscape: Global Semiconductor Intellectual Property Market:

  • ALPHAWAVE SEMI
  • Analog Bits
  • Arm Limited
  • ARTERIS, INC
  • Cadence Design Systems, Inc.
  • CEVA, Inc.
  • Dolphin Design
  • Dream Chip Technologies GmbH
  • eMemory Technology Inc.
  • Eureka Technology, Inc
  • Frontgrade Gaisler
  • Imagination Technologies
  • Lattice Semiconductor
  • Rambus
  • Synopsys, Inc.
  • TOPPAN Holdings Inc.
  • VeriSilicon
  • Other Industry Participants

 Global Semiconductor Intellectual Property Market Scope

Report Specifications Details
Market Revenue in 2023 US$ 7.5 Bn
Market Size Forecast by 2034 US$ 19.7 Bn
Growth Rate (CAGR) 9.2%
Historic Data 2016 – 2022
Base Year for Estimation 2023
Forecast Period 2024 – 2034
Report Inclusions Market Size & Estimates, Market Dynamics, Competitive Scenario, Trends, Growth Factors, Market Determinants, Key Investment Segmentation, Product/Service/Solutions Benchmarking
Segments Covered By IP Core, By Type, By Model, By Application, By Region
Regions Covered North America, Europe, Asia Pacific, Middle East & Africa, Latin America
Countries Covered U.S., Canada, Mexico, Rest of North America,  France, The UK, Spain, Germany, Italy, Nordic Countries (Denmark, Finland, Iceland, Sweden, Norway), Benelux Union (Belgium, The Netherlands, Luxembourg), Rest of Europe,  China, Japan, India, New Zealand, Australia, South Korea, Southeast Asia (Indonesia, Thailand, Malaysia, Singapore, Rest of Southeast Asia), Rest of Asia Pacific,  Saudi Arabia, UAE, Egypt, Kuwait, South Africa, Rest of Middle East & Africa,  Brazil, Argentina, Rest of Latin America
Key Players ALPHAWAVE SEMI, Analog Bits, Arm Limited, ARTERIS, INC, Cadence Design Systems, Inc., CEVA, Inc., Dolphin Design, Dream Chip Technologies GmbH, eMemory Technology Inc., Eureka Technology, Inc, Frontgrade Gaisler, Imagination Technologies, Lattice Semiconductor, Rambus, Synopsys, Inc., TOPPAN Holdings Inc., VeriSilicon
Customization Scope Customization allows for the inclusion/modification of content pertaining to geographical regions, countries, and specific market segments.
Pricing & Procurement Options Explore purchase options tailored to your specific research requirements
Contact Details Consult With Our Expert

Japan (Toll-Free):  +81 663-386-8111

South Korea (Toll-Free):  +82-808- 703-126

Saudi Arabia (Toll-Free):  +966 800-850-1643

United Kingdom: +44 753-710-5080

United States: +1 302-232-5106

E-mail:  askanexpert@thenicheresearch.com


 Global Semiconductor Intellectual Property Market

By IP Core

  • Soft
  • Hard

By Type

  • Processor IP
  • Interface IP
  • Memory IP
  • Microcontroller IP
  • Communication IP
  • Foundation IP
  • Analog IP
  • Security IP
  • Other IP

By Model

  • Per Use
  • Time Based
  • Royalty Based
  • Access Based

By Application

  • Healthcare
  • Automotive
  • Consumer Electronics
  • Telecommunications
  • Others

By Region

  • North America (U.S., Canada, Mexico, Rest of North America)
  • Europe (France, The UK, Spain, Germany, Italy, Nordic Countries (Denmark, Finland, Iceland, Sweden, Norway), Benelux Union (Belgium, The Netherlands, Luxembourg), Rest of Europe)
  • Asia Pacific (China, Japan, India, New Zealand, Australia, South Korea, Southeast Asia (Indonesia, Thailand, Malaysia, Singapore, Rest of Southeast Asia), Rest of Asia Pacific)
  • Middle East & Africa (Saudi Arabia, UAE, Egypt, Kuwait, South Africa, Rest of Middle East & Africa)
  • Latin America (Brazil, Argentina, Rest of Latin America)

Report Layout:

Table of Contents

.

1.Market Scope
1.1.Market Segmentation
1.2.Years Considered
1.2.1.Historic Years: 2016 – 2022
1.2.2.Base Year: 2023
1.2.3.Forecast Years: 2024 – 2034
2.Key Target Audiences
3.Research Methodology
3.1.Primary Research
3.1.1.Research Questionnaire
3.1.2.Global Percentage Breakdown
3.1.3.Primary Interviews: Key Opinion Leaders (KOLs)
3.2.Secondary Research
3.2.1.Paid Databases
3.2.2.Secondary Sources
3.3.Market Size Estimates
3.3.1.Top-Down Approach
3.3.2.Bottom-Up Approach
3.4.Data Triangulation Methodology
3.5.Research Assumptions
4.Recommendations and Insights from TNR’s Perspective**
5.Holistic Overview of Semiconductor Intellectual Property Market
6.Market Synopsis: Semiconductor Intellectual Property Market
7.Semiconductor Intellectual Property Market Analysis: Qualitative Perspective
7.1.Introduction
7.1.1.Product Definition
7.1.2.Industry Development
7.2.Market Dynamics
7.2.1.Drivers
7.2.2.Restraints
7.2.3.Opportunities
7.2.4.Challenges
7.3.Trends in Semiconductor Intellectual Property Market
7.4.Market Determinants Radar Chart
7.5.Macro-Economic and Micro-Economic Indicators: Semiconductor Intellectual Property Market
7.6.Industry Gross Margin Overview
7.7.Porter’s Five Force Analysis
7.8.Impact of Covid-19 on Semiconductor Intellectual Property Market
7.9.PESTEL Analysis
7.10.Value Chain Analysis
7.11.Pricing Analysis, By Region (2023)
7.11.1.North America
7.11.2.Europe
7.11.3.Asia Pacific
7.11.4.Middle East and Africa
7.11.5.Latin America
8.Global Semiconductor Intellectual Property Market Analysis and Forecasts, 2024 – 2034
8.1.Overview
8.1.1.Global Semiconductor Intellectual Property Market Revenue (US$ Mn)
8.2.Global Semiconductor Intellectual Property Market Revenue (US$ Mn) and Forecasts, By IP Core
8.2.1.Soft
8.2.1.1.Definition
8.2.1.2.Market Estimation and Penetration, 2016 – 2023
8.2.1.3.Market Forecast, 2024 – 2034
8.2.1.4.Compound Annual Growth Rate (CAGR)
8.2.1.5.Regional Bifurcation
8.2.1.5.1.North America
8.2.1.5.1.1.Market Estimation, 2016 – 2023
8.2.1.5.1.2.Market Forecast, 2024 – 2034
8.2.1.5.2.Europe
8.2.1.5.2.1.Market Estimation, 2016 – 2023
8.2.1.5.2.2.Market Forecast, 2024 – 2034
8.2.1.5.3.Asia Pacific
8.2.1.5.3.1.Market Estimation, 2016 – 2023
8.2.1.5.3.2.Market Forecast, 2024 – 2034
8.2.1.5.4.Middle East and Africa
8.2.1.5.4.1.Market Estimation, 2016 – 2023
8.2.1.5.4.2.Market Forecast, 2024 – 2034
8.2.1.5.5.Latin America
8.2.1.5.5.1.Market Estimation, 2016 – 2023
8.2.1.5.5.2.Market Forecast, 2024 – 2034
8.2.2.Hard
8.2.2.1.Definition
8.2.2.2.Market Estimation and Penetration, 2016 – 2023
8.2.2.3.Market Forecast, 2024 – 2034
8.2.2.4.Compound Annual Growth Rate (CAGR)
8.2.2.5.Regional Bifurcation
8.2.2.5.1.North America
8.2.2.5.1.1.Market Estimation, 2016 – 2023
8.2.2.5.1.2.Market Forecast, 2024 – 2034
8.2.2.5.2.Europe
8.2.2.5.2.1.Market Estimation, 2016 – 2023
8.2.2.5.2.2.Market Forecast, 2024 – 2034
8.2.2.5.3.Asia Pacific
8.2.2.5.3.1.Market Estimation, 2016 – 2023
8.2.2.5.3.2.Market Forecast, 2024 – 2034
8.2.2.5.4.Middle East and Africa
8.2.2.5.4.1.Market Estimation, 2016 – 2023
8.2.2.5.4.2.Market Forecast, 2024 – 2034
8.2.2.5.5.Latin America
8.2.2.5.5.1.Market Estimation, 2016 – 2023
8.2.2.5.5.2.Market Forecast, 2024 – 2034
8.3.Key Segment for Channeling Investments
8.3.1.By IP Core
9.Global Semiconductor Intellectual Property Market Analysis and Forecasts, 2024 – 2034
9.1.Overview
9.2.Global Semiconductor Intellectual Property Market Revenue (US$ Mn) and Forecasts, By Type
9.2.1.Processor IP
9.2.1.1.Definition
9.2.1.2.Market Estimation and Penetration, 2016 – 2023
9.2.1.3.Market Forecast, 2024 – 2034
9.2.1.4.Compound Annual Growth Rate (CAGR)
9.2.1.5.Regional Bifurcation
9.2.1.5.1.North America
9.2.1.5.1.1.Market Estimation, 2016 – 2023
9.2.1.5.1.2.Market Forecast, 2024 – 2034
9.2.1.5.2.Europe
9.2.1.5.2.1.Market Estimation, 2016 – 2023
9.2.1.5.2.2.Market Forecast, 2024 – 2034
9.2.1.5.3.Asia Pacific
9.2.1.5.3.1.Market Estimation, 2016 – 2023
9.2.1.5.3.2.Market Forecast, 2024 – 2034
9.2.1.5.4.Middle East and Africa
9.2.1.5.4.1.Market Estimation, 2016 – 2023
9.2.1.5.4.2.Market Forecast, 2024 – 2034
9.2.1.5.5.Latin America
9.2.1.5.5.1.Market Estimation, 2016 – 2023
9.2.1.5.5.2.Market Forecast, 2024 – 2034
9.2.2.Interface IP
9.2.2.1.Definition
9.2.2.2.Market Estimation and Penetration, 2016 – 2023
9.2.2.3.Market Forecast, 2024 – 2034
9.2.2.4.Compound Annual Growth Rate (CAGR)
9.2.2.5.Regional Bifurcation
9.2.2.5.1.North America
9.2.2.5.1.1.Market Estimation, 2016 – 2023
9.2.2.5.1.2.Market Forecast, 2024 – 2034
9.2.2.5.2.Europe
9.2.2.5.2.1.Market Estimation, 2016 – 2023
9.2.2.5.2.2.Market Forecast, 2024 – 2034
9.2.2.5.3.Asia Pacific
9.2.2.5.3.1.Market Estimation, 2016 – 2023
9.2.2.5.3.2.Market Forecast, 2024 – 2034
9.2.2.5.4.Middle East and Africa
9.2.2.5.4.1.Market Estimation, 2016 – 2023
9.2.2.5.4.2.Market Forecast, 2024 – 2034
9.2.2.5.5.Latin America
9.2.2.5.5.1.Market Estimation, 2016 – 2023
9.2.2.5.5.2.Market Forecast, 2024 – 2034
9.2.3.Memory IP
9.2.3.1.Definition
9.2.3.2.Market Estimation and Penetration, 2016 – 2023
9.2.3.3.Market Forecast, 2024 – 2034
9.2.3.4.Compound Annual Growth Rate (CAGR)
9.2.3.5.Regional Bifurcation
9.2.3.5.1.North America
9.2.3.5.1.1.Market Estimation, 2016 – 2023
9.2.3.5.1.2.Market Forecast, 2024 – 2034
9.2.3.5.2.Europe
9.2.3.5.2.1.Market Estimation, 2016 – 2023
9.2.3.5.2.2.Market Forecast, 2024 – 2034
9.2.3.5.3.Asia Pacific
9.2.3.5.3.1.Market Estimation, 2016 – 2023
9.2.3.5.3.2.Market Forecast, 2024 – 2034
9.2.3.5.4.Middle East and Africa
9.2.3.5.4.1.Market Estimation, 2016 – 2023
9.2.3.5.4.2.Market Forecast, 2024 – 2034
9.2.3.5.5.Latin America
9.2.3.5.5.1.Market Estimation, 2016 – 2023
9.2.3.5.5.2.Market Forecast, 2024 – 2034
9.2.4.Microcontroller IP
9.2.4.1.Definition
9.2.4.2.Market Estimation and Penetration, 2016 – 2023
9.2.4.3.Market Forecast, 2024 – 2034
9.2.4.4.Compound Annual Growth Rate (CAGR)
9.2.4.5.Regional Bifurcation
9.2.4.5.1.North America
9.2.4.5.1.1.Market Estimation, 2016 – 2023
9.2.4.5.1.2.Market Forecast, 2024 – 2034
9.2.4.5.2.Europe
9.2.4.5.2.1.Market Estimation, 2016 – 2023
9.2.4.5.2.2.Market Forecast, 2024 – 2034
9.2.4.5.3.Asia Pacific
9.2.4.5.3.1.Market Estimation, 2016 – 2023
9.2.4.5.3.2.Market Forecast, 2024 – 2034
9.2.4.5.4.Middle East and Africa
9.2.4.5.4.1.Market Estimation, 2016 – 2023
9.2.4.5.4.2.Market Forecast, 2024 – 2034
9.2.4.5.5.Latin America
9.2.4.5.5.1.Market Estimation, 2016 – 2023
9.2.4.5.5.2.Market Forecast, 2024 – 2034
9.2.5.Communication IP
9.2.5.1.Definition
9.2.5.2.Market Estimation and Penetration, 2016 – 2023
9.2.5.3.Market Forecast, 2024 – 2034
9.2.5.4.Compound Annual Growth Rate (CAGR)
9.2.5.5.Regional Bifurcation
9.2.5.5.1.North America
9.2.5.5.1.1.Market Estimation, 2016 – 2023
9.2.5.5.1.2.Market Forecast, 2024 – 2034
9.2.5.5.2.Europe
9.2.5.5.2.1.Market Estimation, 2016 – 2023
9.2.5.5.2.2.Market Forecast, 2024 – 2034
9.2.5.5.3.Asia Pacific
9.2.5.5.3.1.Market Estimation, 2016 – 2023
9.2.5.5.3.2.Market Forecast, 2024 – 2034
9.2.5.5.4.Middle East and Africa
9.2.5.5.4.1.Market Estimation, 2016 – 2023
9.2.5.5.4.2.Market Forecast, 2024 – 2034
9.2.5.5.5.Latin America
9.2.5.5.5.1.Market Estimation, 2016 – 2023
9.2.5.5.5.2.Market Forecast, 2024 – 2034
9.2.6.Foundation IP
9.2.6.1.Definition
9.2.6.2.Market Estimation and Penetration, 2016 – 2023
9.2.6.3.Market Forecast, 2024 – 2034
9.2.6.4.Compound Annual Growth Rate (CAGR)
9.2.6.5.Regional Bifurcation
9.2.6.5.1.North America
9.2.6.5.1.1.Market Estimation, 2016 – 2023
9.2.6.5.1.2.Market Forecast, 2024 – 2034
9.2.6.5.2.Europe
9.2.6.5.2.1.Market Estimation, 2016 – 2023
9.2.6.5.2.2.Market Forecast, 2024 – 2034
9.2.6.5.3.Asia Pacific
9.2.6.5.3.1.Market Estimation, 2016 – 2023
9.2.6.5.3.2.Market Forecast, 2024 – 2034
9.2.6.5.4.Middle East and Africa
9.2.6.5.4.1.Market Estimation, 2016 – 2023
9.2.6.5.4.2.Market Forecast, 2024 – 2034
9.2.6.5.5.Latin America
9.2.6.5.5.1.Market Estimation, 2016 – 2023
9.2.6.5.5.2.Market Forecast, 2024 – 2034
9.2.7.Analog IP
9.2.7.1.Definition
9.2.7.2.Market Estimation and Penetration, 2016 – 2023
9.2.7.3.Market Forecast, 2024 – 2034
9.2.7.4.Compound Annual Growth Rate (CAGR)
9.2.7.5.Regional Bifurcation
9.2.7.5.1.North America
9.2.7.5.1.1.Market Estimation, 2016 – 2023
9.2.7.5.1.2.Market Forecast, 2024 – 2034
9.2.7.5.2.Europe
9.2.7.5.2.1.Market Estimation, 2016 – 2023
9.2.7.5.2.2.Market Forecast, 2024 – 2034
9.2.7.5.3.Asia Pacific
9.2.7.5.3.1.Market Estimation, 2016 – 2023
9.2.7.5.3.2.Market Forecast, 2024 – 2034
9.2.7.5.4.Middle East and Africa
9.2.7.5.4.1.Market Estimation, 2016 – 2023
9.2.7.5.4.2.Market Forecast, 2024 – 2034
9.2.7.5.5.Latin America
9.2.7.5.5.1.Market Estimation, 2016 – 2023
9.2.7.5.5.2.Market Forecast, 2024 – 2034
9.2.8.Security IP
9.2.8.1.Definition
9.2.8.2.Market Estimation and Penetration, 2016 – 2023
9.2.8.3.Market Forecast, 2024 – 2034
9.2.8.4.Compound Annual Growth Rate (CAGR)
9.2.8.5.Regional Bifurcation
9.2.8.5.1.North America
9.2.8.5.1.1.Market Estimation, 2016 – 2023
9.2.8.5.1.2.Market Forecast, 2024 – 2034
9.2.8.5.2.Europe
9.2.8.5.2.1.Market Estimation, 2016 – 2023
9.2.8.5.2.2.Market Forecast, 2024 – 2034
9.2.8.5.3.Asia Pacific
9.2.8.5.3.1.Market Estimation, 2016 – 2023
9.2.8.5.3.2.Market Forecast, 2024 – 2034
9.2.8.5.4.Middle East and Africa
9.2.8.5.4.1.Market Estimation, 2016 – 2023
9.2.8.5.4.2.Market Forecast, 2024 – 2034
9.2.8.5.5.Latin America
9.2.8.5.5.1.Market Estimation, 2016 – 2023
9.2.8.5.5.2.Market Forecast, 2024 – 2034
9.2.9.Others
9.2.9.1.Definition
9.2.9.2.Market Estimation and Penetration, 2016 – 2023
9.2.9.3.Market Forecast, 2024 – 2034
9.2.9.4.Compound Annual Growth Rate (CAGR)
9.2.9.5.Regional Bifurcation
9.2.9.5.1.North America
9.2.9.5.1.1.Market Estimation, 2016 – 2023
9.2.9.5.1.2.Market Forecast, 2024 – 2034
9.2.9.5.2.Europe
9.2.9.5.2.1.Market Estimation, 2016 – 2023
9.2.9.5.2.2.Market Forecast, 2024 – 2034
9.2.9.5.3.Asia Pacific
9.2.9.5.3.1.Market Estimation, 2016 – 2023
9.2.9.5.3.2.Market Forecast, 2024 – 2034
9.2.9.5.4.Middle East and Africa
9.2.9.5.4.1.Market Estimation, 2016 – 2023
9.2.9.5.4.2.Market Forecast, 2024 – 2034
9.2.9.5.5.Latin America
9.2.9.5.5.1.Market Estimation, 2016 – 2023
9.2.9.5.5.2.Market Forecast, 2024 – 2034
9.3.Key Segment for Channeling Investments
9.3.1.By Type
10.Global Semiconductor Intellectual Property Market Analysis and Forecasts, 2024 – 2034
10.1.Overview
10.2.Global Semiconductor Intellectual Property Market Revenue (US$ Mn) and Forecasts, By Model
10.2.1.Per Use
10.2.1.1.Definition
10.2.1.2.Market Estimation and Penetration, 2016 – 2023
10.2.1.3.Market Forecast, 2024 – 2034
10.2.1.4.Compound Annual Growth Rate (CAGR)
10.2.1.5.Regional Bifurcation
10.2.1.5.1.North America
10.2.1.5.1.1.Market Estimation, 2016 – 2023
10.2.1.5.1.2.Market Forecast, 2024 – 2034
10.2.1.5.2.Europe
10.2.1.5.2.1.Market Estimation, 2016 – 2023
10.2.1.5.2.2.Market Forecast, 2024 – 2034
10.2.1.5.3.Asia Pacific
10.2.1.5.3.1.Market Estimation, 2016 – 2023
10.2.1.5.3.2.Market Forecast, 2024 – 2034
10.2.1.5.4.Middle East and Africa
10.2.1.5.4.1.Market Estimation, 2016 – 2023
10.2.1.5.4.2.Market Forecast, 2024 – 2034
10.2.1.5.5.Latin America
10.2.1.5.5.1.Market Estimation, 2016 – 2023
10.2.1.5.5.2.Market Forecast, 2024 – 2034
10.2.2.Time Based
10.2.2.1.Definition
10.2.2.2.Market Estimation and Penetration, 2016 – 2023
10.2.2.3.Market Forecast, 2024 – 2034
10.2.2.4.Compound Annual Growth Rate (CAGR)
10.2.2.5.Regional Bifurcation
10.2.2.5.1.North America
10.2.2.5.1.1.Market Estimation, 2016 – 2023
10.2.2.5.1.2.Market Forecast, 2024 – 2034
10.2.2.5.2.Europe
10.2.2.5.2.1.Market Estimation, 2016 – 2023
10.2.2.5.2.2.Market Forecast, 2024 – 2034
10.2.2.5.3.Asia Pacific
10.2.2.5.3.1.Market Estimation, 2016 – 2023
10.2.2.5.3.2.Market Forecast, 2024 – 2034
10.2.2.5.4.Middle East and Africa
10.2.2.5.4.1.Market Estimation, 2016 – 2023
10.2.2.5.4.2.Market Forecast, 2024 – 2034
10.2.2.5.5.Latin America
10.2.2.5.5.1.Market Estimation, 2016 – 2023
10.2.2.5.5.2.Market Forecast, 2024 – 2034
10.2.3.Royalty Based
10.2.3.1.Definition
10.2.3.2.Market Estimation and Penetration, 2016 – 2023
10.2.3.3.Market Forecast, 2024 – 2034
10.2.3.4.Compound Annual Growth Rate (CAGR)
10.2.3.5.Regional Bifurcation
10.2.3.5.1.North America
10.2.3.5.1.1.Market Estimation, 2016 – 2023
10.2.3.5.1.2.Market Forecast, 2024 – 2034
10.2.3.5.2.Europe
10.2.3.5.2.1.Market Estimation, 2016 – 2023
10.2.3.5.2.2.Market Forecast, 2024 – 2034
10.2.3.5.3.Asia Pacific
10.2.3.5.3.1.Market Estimation, 2016 – 2023
10.2.3.5.3.2.Market Forecast, 2024 – 2034
10.2.3.5.4.Middle East and Africa
10.2.3.5.4.1.Market Estimation, 2016 – 2023
10.2.3.5.4.2.Market Forecast, 2024 – 2034
10.2.3.5.5.Latin America
10.2.3.5.5.1.Market Estimation, 2016 – 2023
10.2.3.5.5.2.Market Forecast, 2024 – 2034
10.2.4.Access Based
10.2.4.1.Definition
10.2.4.2.Market Estimation and Penetration, 2016 – 2023
10.2.4.3.Market Forecast, 2024 – 2034
10.2.4.4.Compound Annual Growth Rate (CAGR)
10.2.4.5.Regional Bifurcation
10.2.4.5.1.North America
10.2.4.5.1.1.Market Estimation, 2016 – 2023
10.2.4.5.1.2.Market Forecast, 2024 – 2034
10.2.4.5.2.Europe
10.2.4.5.2.1.Market Estimation, 2016 – 2023
10.2.4.5.2.2.Market Forecast, 2024 – 2034
10.2.4.5.3.Asia Pacific
10.2.4.5.3.1.Market Estimation, 2016 – 2023
10.2.4.5.3.2.Market Forecast, 2024 – 2034
10.2.4.5.4.Middle East and Africa
10.2.4.5.4.1.Market Estimation, 2016 – 2023
10.2.4.5.4.2.Market Forecast, 2024 – 2034
10.2.4.5.5.Latin America
10.2.4.5.5.1.Market Estimation, 2016 – 2023
10.2.4.5.5.2.Market Forecast, 2024 – 2034
10.3.Key Segment for Channeling Investments
10.3.1.By Model
11.Global Semiconductor Intellectual Property Market Analysis and Forecasts, 2024 – 2034
11.1.Overview
11.2.Global Semiconductor Intellectual Property Market Revenue (US$ Mn) and Forecasts, By Application
11.2.1.Healthcare
11.2.1.1.Definition
11.2.1.2.Market Estimation and Penetration, 2016 – 2023
11.2.1.3.Market Forecast, 2024 – 2034
11.2.1.4.Compound Annual Growth Rate (CAGR)
11.2.1.5.Regional Bifurcation
11.2.1.5.1.North America
11.2.1.5.1.1.Market Estimation, 2016 – 2023
11.2.1.5.1.2.Market Forecast, 2024 – 2034
11.2.1.5.2.Europe
11.2.1.5.2.1.Market Estimation, 2016 – 2023
11.2.1.5.2.2.Market Forecast, 2024 – 2034
11.2.1.5.3.Asia Pacific
11.2.1.5.3.1.Market Estimation, 2016 – 2023
11.2.1.5.3.2.Market Forecast, 2024 – 2034
11.2.1.5.4.Middle East and Africa
11.2.1.5.4.1.Market Estimation, 2016 – 2023
11.2.1.5.4.2.Market Forecast, 2024 – 2034
11.2.1.5.5.Latin America
11.2.1.5.5.1.Market Estimation, 2016 – 2023
11.2.1.5.5.2.Market Forecast, 2024 – 2034
11.2.2.Automotive
11.2.2.1.Definition
11.2.2.2.Market Estimation and Penetration, 2016 – 2023
11.2.2.3.Market Forecast, 2024 – 2034
11.2.2.4.Compound Annual Growth Rate (CAGR)
11.2.2.5.Regional Bifurcation
11.2.2.5.1.North America
11.2.2.5.1.1.Market Estimation, 2016 – 2023
11.2.2.5.1.2.Market Forecast, 2024 – 2034
11.2.2.5.2.Europe
11.2.2.5.2.1.Market Estimation, 2016 – 2023
11.2.2.5.2.2.Market Forecast, 2024 – 2034
11.2.2.5.3.Asia Pacific
11.2.2.5.3.1.Market Estimation, 2016 – 2023
11.2.2.5.3.2.Market Forecast, 2024 – 2034
11.2.2.5.4.Middle East and Africa
11.2.2.5.4.1.Market Estimation, 2016 – 2023
11.2.2.5.4.2.Market Forecast, 2024 – 2034
11.2.2.5.5.Latin America
11.2.2.5.5.1.Market Estimation, 2016 – 2023
11.2.2.5.5.2.Market Forecast, 2024 – 2034
11.2.3.Consumer Electronics
11.2.3.1.Definition
11.2.3.2.Market Estimation and Penetration, 2016 – 2023
11.2.3.3.Market Forecast, 2024 – 2034
11.2.3.4.Compound Annual Growth Rate (CAGR)
11.2.3.5.Regional Bifurcation
11.2.3.5.1.North America
11.2.3.5.1.1.Market Estimation, 2016 – 2023
11.2.3.5.1.2.Market Forecast, 2024 – 2034
11.2.3.5.2.Europe
11.2.3.5.2.1.Market Estimation, 2016 – 2023
11.2.3.5.2.2.Market Forecast, 2024 – 2034
11.2.3.5.3.Asia Pacific
11.2.3.5.3.1.Market Estimation, 2016 – 2023
11.2.3.5.3.2.Market Forecast, 2024 – 2034
11.2.3.5.4.Middle East and Africa
11.2.3.5.4.1.Market Estimation, 2016 – 2023
11.2.3.5.4.2.Market Forecast, 2024 – 2034
11.2.3.5.5.Latin America
11.2.3.5.5.1.Market Estimation, 2016 – 2023
11.2.3.5.5.2.Market Forecast, 2024 – 2034
11.2.4.Telecommunications
11.2.4.1.Definition
11.2.4.2.Market Estimation and Penetration, 2016 – 2023
11.2.4.3.Market Forecast, 2024 – 2034
11.2.4.4.Compound Annual Growth Rate (CAGR)
11.2.4.5.Regional Bifurcation
11.2.4.5.1.North America
11.2.4.5.1.1.Market Estimation, 2016 – 2023
11.2.4.5.1.2.Market Forecast, 2024 – 2034
11.2.4.5.2.Europe
11.2.4.5.2.1.Market Estimation, 2016 – 2023
11.2.4.5.2.2.Market Forecast, 2024 – 2034
11.2.4.5.3.Asia Pacific
11.2.4.5.3.1.Market Estimation, 2016 – 2023
11.2.4.5.3.2.Market Forecast, 2024 – 2034
11.2.4.5.4.Middle East and Africa
11.2.4.5.4.1.Market Estimation, 2016 – 2023
11.2.4.5.4.2.Market Forecast, 2024 – 2034
11.2.4.5.5.Latin America
11.2.4.5.5.1.Market Estimation, 2016 – 2023
11.2.4.5.5.2.Market Forecast, 2024 – 2034
11.2.5.Others
11.2.5.1.Definition
11.2.5.2.Market Estimation and Penetration, 2016 – 2023
11.2.5.3.Market Forecast, 2024 – 2034
11.2.5.4.Compound Annual Growth Rate (CAGR)
11.2.5.5.Regional Bifurcation
11.2.5.5.1.North America
11.2.5.5.1.1.Market Estimation, 2016 – 2023
11.2.5.5.1.2.Market Forecast, 2024 – 2034
11.2.5.5.2.Europe
11.2.5.5.2.1.Market Estimation, 2016 – 2023
11.2.5.5.2.2.Market Forecast, 2024 – 2034
11.2.5.5.3.Asia Pacific
11.2.5.5.3.1.Market Estimation, 2016 – 2023
11.2.5.5.3.2.Market Forecast, 2024 – 2034
11.2.5.5.4.Middle East and Africa
11.2.5.5.4.1.Market Estimation, 2016 – 2023
11.2.5.5.4.2.Market Forecast, 2024 – 2034
11.2.5.5.5.Latin America
11.2.5.5.5.1.Market Estimation, 2016 – 2023
11.2.5.5.5.2.Market Forecast, 2024 – 2034
11.3.Key Segment for Channeling Investments
11.3.1.By Application
12.North America Semiconductor Intellectual Property Market Analysis and Forecasts, 2024 – 2034
12.1.Overview
12.1.1.North America Semiconductor Intellectual Property Market Revenue (US$ Mn)
12.2.North America Semiconductor Intellectual Property Market Revenue (US$ Mn) and Forecasts, By IP Core
12.2.1.Soft
12.2.2.Hard
12.3.North America Semiconductor Intellectual Property Market Revenue (US$ Mn) and Forecasts, By Type
12.3.1.Processor IP
12.3.2.Interface IP
12.3.3.Memory IP
12.3.4.Microcontroller IP
12.3.5.Communication IP
12.3.6.Foundation IP
12.3.7.Analog IP
12.3.8.Security IP
12.3.9.Others
12.4.North America Semiconductor Intellectual Property Market Revenue (US$ Mn) and Forecasts, By Model
12.4.1.Per Use
12.4.2.Time Based
12.4.3.Royalty Based
12.4.4.Access Based
12.5.North America Semiconductor Intellectual Property Market Revenue (US$ Mn) and Forecasts, By Application
12.5.1.Healthcare
12.5.2.Automotive
12.5.3.Consumer Electronics
12.5.4.Telecommunications
12.5.5.Others
12.6.North America Semiconductor Intellectual Property Market Revenue (US$ Mn) and Forecasts, By Country
12.6.1.U.S
12.6.1.1.U.S Semiconductor Intellectual Property Market Revenue (US$ Mn) and Forecasts, By IP Core
12.6.1.1.1.Soft
12.6.1.1.2.Hard
12.6.1.2.U.S Semiconductor Intellectual Property Market Revenue (US$ Mn) and Forecasts, By Type
12.6.1.2.1.Processor IP
12.6.1.2.2.Interface IP
12.6.1.2.3.Memory IP
12.6.1.2.4.Microcontroller IP
12.6.1.2.5.Communication IP
12.6.1.2.6.Foundation IP
12.6.1.2.7.Analog IP
12.6.1.2.8.Security IP
12.6.1.2.9.Others
12.6.1.3.U.S Semiconductor Intellectual Property Market Revenue (US$ Mn) and Forecasts, By Model
12.6.1.3.1.Per Use
12.6.1.3.2.Time Based
12.6.1.3.3.Royalty Based
12.6.1.3.4.Access Based
12.6.1.4.U.S Semiconductor Intellectual Property Market Revenue (US$ Mn) and Forecasts, By Application
12.6.1.4.1.Healthcare
12.6.1.4.2.Automotive
12.6.1.4.3.Consumer Electronics
12.6.1.4.4.Telecommunications
12.6.1.4.5.Others
12.6.2.Canada
12.6.2.1.Canada Semiconductor Intellectual Property Market Revenue (US$ Mn) and Forecasts, By IP Core
12.6.2.1.1.Soft
12.6.2.1.2.Hard
12.6.2.2.Canada Semiconductor Intellectual Property Market Revenue (US$ Mn) and Forecasts, By Type
12.6.2.2.1.Processor IP
12.6.2.2.2.Interface IP
12.6.2.2.3.Memory IP
12.6.2.2.4.Microcontroller IP
12.6.2.2.5.Communication IP
12.6.2.2.6.Foundation IP
12.6.2.2.7.Analog IP
12.6.2.2.8.Security IP
12.6.2.2.9.Others
12.6.2.3.Canada Semiconductor Intellectual Property Market Revenue (US$ Mn) and Forecasts, By Model
12.6.2.3.1.Per Use
12.6.2.3.2.Time Based
12.6.2.3.3.Royalty Based
12.6.2.3.4.Access Based
12.6.2.4.Canada Semiconductor Intellectual Property Market Revenue (US$ Mn) and Forecasts, By Application
12.6.2.4.1.Healthcare
12.6.2.4.2.Automotive
12.6.2.4.3.Consumer Electronics
12.6.2.4.4.Telecommunications
12.6.2.4.5.Others
12.6.3.Mexico
12.6.3.1.Mexico Semiconductor Intellectual Property Market Revenue (US$ Mn) and Forecasts, By IP Core
12.6.3.1.1.Soft
12.6.3.1.2.Hard
12.6.3.2.Mexico Semiconductor Intellectual Property Market Revenue (US$ Mn) and Forecasts, By Type
12.6.3.2.1.Processor IP
12.6.3.2.2.Interface IP
12.6.3.2.3.Memory IP
12.6.3.2.4.Microcontroller IP
12.6.3.2.5.Communication IP
12.6.3.2.6.Foundation IP
12.6.3.2.7.Analog IP
12.6.3.2.8.Security IP
12.6.3.2.9.Others
12.6.3.3.Mexico Semiconductor Intellectual Property Market Revenue (US$ Mn) and Forecasts, By Model
12.6.3.3.1.Per Use
12.6.3.3.2.Time Based
12.6.3.3.3.Royalty Based
12.6.3.3.4.Access Based
12.6.3.4.Mexico Semiconductor Intellectual Property Market Revenue (US$ Mn) and Forecasts, By Application
12.6.3.4.1.Healthcare
12.6.3.4.2.Automotive
12.6.3.4.3.Consumer Electronics
12.6.3.4.4.Telecommunications
12.6.3.4.5.Others
12.6.4.Rest of North America
12.6.4.1.Rest of North America Semiconductor Intellectual Property Market Revenue (US$ Mn) and Forecasts, By IP Core
12.6.4.1.1.Soft
12.6.4.1.2.Hard
12.6.4.2.Rest of North America Semiconductor Intellectual Property Market Revenue (US$ Mn) and Forecasts, By Type
12.6.4.2.1.Processor IP
12.6.4.2.2.Interface IP
12.6.4.2.3.Memory IP
12.6.4.2.4.Microcontroller IP
12.6.4.2.5.Communication IP
12.6.4.2.6.Foundation IP
12.6.4.2.7.Analog IP
12.6.4.2.8.Security IP
12.6.4.2.9.Others
12.6.4.3.Rest of North America Semiconductor Intellectual Property Market Revenue (US$ Mn) and Forecasts, By Model
12.6.4.3.1.Per Use
12.6.4.3.2.Time Based
12.6.4.3.3.Royalty Based
12.6.4.3.4.Access Based
12.6.4.4.Rest of North America Semiconductor Intellectual Property Market Revenue (US$ Mn) and Forecasts, By Application
12.6.4.4.1.Healthcare
12.6.4.4.2.Automotive
12.6.4.4.3.Consumer Electronics
12.6.4.4.4.Telecommunications
12.6.4.4.5.Others
12.7.Key Segment for Channeling Investments
12.7.1.By Country
12.7.2.By IP Core
12.7.3.By Type
12.7.4.By Model
12.7.5.By Application
13.Europe Semiconductor Intellectual Property Market Analysis and Forecasts, 2024 – 2034
13.1.Overview
13.1.1.Europe Semiconductor Intellectual Property Market Revenue (US$ Mn)
13.2.Europe Semiconductor Intellectual Property Market Revenue (US$ Mn) and Forecasts, By IP Core
13.2.1.Soft
13.2.2.Hard
13.3.Europe Semiconductor Intellectual Property Market Revenue (US$ Mn) and Forecasts, By Type
13.3.1.Processor IP
13.3.2.Interface IP
13.3.3.Memory IP
13.3.4.Microcontroller IP
13.3.5.Communication IP
13.3.6.Foundation IP
13.3.7.Analog IP
13.3.8.Security IP
13.3.9.Others
13.4.Europe Semiconductor Intellectual Property Market Revenue (US$ Mn) and Forecasts, By Model
13.4.1.Per Use
13.4.2.Time Based
13.4.3.Royalty Based
13.4.4.Access Based
13.5.Europe Semiconductor Intellectual Property Market Revenue (US$ Mn) and Forecasts, By Application
13.5.1.Healthcare
13.5.2.Automotive
13.5.3.Consumer Electronics
13.5.4.Telecommunications
13.5.5.Others
13.6.Europe Semiconductor Intellectual Property Market Revenue (US$ Mn) and Forecasts, By Country
13.6.1.France
13.6.1.1.France Semiconductor Intellectual Property Market Revenue (US$ Mn) and Forecasts, By IP Core
13.6.1.1.1.Soft
13.6.1.1.2.Hard
13.6.1.2.France Semiconductor Intellectual Property Market Revenue (US$ Mn) and Forecasts, By Type
13.6.1.2.1.Processor IP
13.6.1.2.2.Interface IP
13.6.1.2.3.Memory IP
13.6.1.2.4.Microcontroller IP
13.6.1.2.5.Communication IP
13.6.1.2.6.Foundation IP
13.6.1.2.7.Analog IP
13.6.1.2.8.Security IP
13.6.1.2.9.Others
13.6.1.3.France Semiconductor Intellectual Property Market Revenue (US$ Mn) and Forecasts, By Model
13.6.1.3.1.Per Use
13.6.1.3.2.Time Based
13.6.1.3.3.Royalty Based
13.6.1.3.4.Access Based
13.6.1.4.France Semiconductor Intellectual Property Market Revenue (US$ Mn) and Forecasts, By Application
13.6.1.4.1.Healthcare
13.6.1.4.2.Automotive
13.6.1.4.3.Consumer Electronics
13.6.1.4.4.Telecommunications
13.6.1.4.5.Others
13.6.2.The UK
13.6.2.1.The UK Semiconductor Intellectual Property Market Revenue (US$ Mn) and Forecasts, By IP Core
13.6.2.1.1.Soft
13.6.2.1.2.Hard
13.6.2.2.The UK Semiconductor Intellectual Property Market Revenue (US$ Mn) and Forecasts, By Type
13.6.2.2.1.Processor IP
13.6.2.2.2.Interface IP
13.6.2.2.3.Memory IP
13.6.2.2.4.Microcontroller IP
13.6.2.2.5.Communication IP
13.6.2.2.6.Foundation IP
13.6.2.2.7.Analog IP
13.6.2.2.8.Security IP
13.6.2.2.9.Others
13.6.2.3.The UK Semiconductor Intellectual Property Market Revenue (US$ Mn) and Forecasts, By Model
13.6.2.3.1.Per Use
13.6.2.3.2.Time Based
13.6.2.3.3.Royalty Based
13.6.2.3.4.Access Based
13.6.2.4.The UK Semiconductor Intellectual Property Market Revenue (US$ Mn) and Forecasts, By Application
13.6.2.4.1.Healthcare
13.6.2.4.2.Automotive
13.6.2.4.3.Consumer Electronics
13.6.2.4.4.Telecommunications
13.6.2.4.5.Others
13.6.3.Spain
13.6.3.1.Spain Semiconductor Intellectual Property Market Revenue (US$ Mn) and Forecasts, By IP Core
13.6.3.1.1.Soft
13.6.3.1.2.Hard
13.6.3.2.Spain Semiconductor Intellectual Property Market Revenue (US$ Mn) and Forecasts, By Type
13.6.3.2.1.Processor IP
13.6.3.2.2.Interface IP
13.6.3.2.3.Memory IP
13.6.3.2.4.Microcontroller IP
13.6.3.2.5.Communication IP
13.6.3.2.6.Foundation IP
13.6.3.2.7.Analog IP
13.6.3.2.8.Security IP
13.6.3.2.9.Others
13.6.3.3.Spain Semiconductor Intellectual Property Market Revenue (US$ Mn) and Forecasts, By Model
13.6.3.3.1.Per Use
13.6.3.3.2.Time Based
13.6.3.3.3.Royalty Based
13.6.3.3.4.Access Based
13.6.3.4.Spain Semiconductor Intellectual Property Market Revenue (US$ Mn) and Forecasts, By Application
13.6.3.4.1.Healthcare
13.6.3.4.2.Automotive
13.6.3.4.3.Consumer Electronics
13.6.3.4.4.Telecommunications
13.6.3.4.5.Others
13.6.4.Germany
13.6.4.1.Germany Semiconductor Intellectual Property Market Revenue (US$ Mn) and Forecasts, By IP Core
13.6.4.1.1.Soft
13.6.4.1.2.Hard
13.6.4.2.Germany Semiconductor Intellectual Property Market Revenue (US$ Mn) and Forecasts, By Type
13.6.4.2.1.Processor IP
13.6.4.2.2.Interface IP
13.6.4.2.3.Memory IP
13.6.4.2.4.Microcontroller IP
13.6.4.2.5.Communication IP
13.6.4.2.6.Foundation IP
13.6.4.2.7.Analog IP
13.6.4.2.8.Security IP
13.6.4.2.9.Others
13.6.4.3.Germany Semiconductor Intellectual Property Market Revenue (US$ Mn) and Forecasts, By Model
13.6.4.3.1.Per Use
13.6.4.3.2.Time Based
13.6.4.3.3.Royalty Based
13.6.4.3.4.Access Based
13.6.4.4.Germany Semiconductor Intellectual Property Market Revenue (US$ Mn) and Forecasts, By Application
13.6.4.4.1.Healthcare
13.6.4.4.2.Automotive
13.6.4.4.3.Consumer Electronics
13.6.4.4.4.Telecommunications
13.6.4.4.5.Others
13.6.5.Italy
13.6.5.1.Italy Semiconductor Intellectual Property Market Revenue (US$ Mn) and Forecasts, By IP Core
13.6.5.1.1.Soft
13.6.5.1.2.Hard
13.6.5.2.Italy Semiconductor Intellectual Property Market Revenue (US$ Mn) and Forecasts, By Type
13.6.5.2.1.Processor IP
13.6.5.2.2.Interface IP
13.6.5.2.3.Memory IP
13.6.5.2.4.Microcontroller IP
13.6.5.2.5.Communication IP
13.6.5.2.6.Foundation IP
13.6.5.2.7.Analog IP
13.6.5.2.8.Security IP
13.6.5.2.9.Others
13.6.5.3.Italy Semiconductor Intellectual Property Market Revenue (US$ Mn) and Forecasts, By Model
13.6.5.3.1.Per Use
13.6.5.3.2.Time Based
13.6.5.3.3.Royalty Based
13.6.5.3.4.Access Based
13.6.5.4.Italy Semiconductor Intellectual Property Market Revenue (US$ Mn) and Forecasts, By Application
13.6.5.4.1.Healthcare
13.6.5.4.2.Automotive
13.6.5.4.3.Consumer Electronics
13.6.5.4.4.Telecommunications
13.6.5.4.5.Others
13.6.6.Nordic Countries
13.6.6.1.Nordic Countries Semiconductor Intellectual Property Market Revenue (US$ Mn) and Forecasts, By IP Core
13.6.6.1.1.Soft
13.6.6.1.2.Hard
13.6.6.2.Nordic Countries Semiconductor Intellectual Property Market Revenue (US$ Mn) and Forecasts, By Type
13.6.6.2.1.Processor IP
13.6.6.2.2.Interface IP
13.6.6.2.3.Memory IP
13.6.6.2.4.Microcontroller IP
13.6.6.2.5.Communication IP
13.6.6.2.6.Foundation IP
13.6.6.2.7.Analog IP
13.6.6.2.8.Security IP
13.6.6.2.9.Others
13.6.6.3.Nordic Countries Semiconductor Intellectual Property Market Revenue (US$ Mn) and Forecasts, By Model
13.6.6.3.1.Per Use
13.6.6.3.2.Time Based
13.6.6.3.3.Royalty Based
13.6.6.3.4.Access Based
13.6.6.4.Nordic Countries Semiconductor Intellectual Property Market Revenue (US$ Mn) and Forecasts, By Application
13.6.6.4.1.Healthcare
13.6.6.4.2.Automotive
13.6.6.4.3.Consumer Electronics
13.6.6.4.4.Telecommunications
13.6.6.4.5.Others
13.6.6.5.Nordic Countries Semiconductor Intellectual Property Market Revenue (US$ Mn) and Forecasts, By Country
13.6.6.5.1.Denmark
13.6.6.5.2.Finland
13.6.6.5.3.Iceland
13.6.6.5.4.Sweden
13.6.6.5.5.Norway
13.6.7.Benelux Union
13.6.7.1.Benelux Union Semiconductor Intellectual Property Market Revenue (US$ Mn) and Forecasts, By IP Core
13.6.7.1.1.Soft
13.6.7.1.2.Hard
13.6.7.2.Benelux Union Semiconductor Intellectual Property Market Revenue (US$ Mn) and Forecasts, By Type
13.6.7.2.1.Processor IP
13.6.7.2.2.Interface IP
13.6.7.2.3.Memory IP
13.6.7.2.4.Microcontroller IP
13.6.7.2.5.Communication IP
13.6.7.2.6.Foundation IP
13.6.7.2.7.Analog IP
13.6.7.2.8.Security IP
13.6.7.2.9.Others
13.6.7.3.Benelux Union Semiconductor Intellectual Property Market Revenue (US$ Mn) and Forecasts, By Model
13.6.7.3.1.Per Use
13.6.7.3.2.Time Based
13.6.7.3.3.Royalty Based
13.6.7.3.4.Access Based
13.6.7.4.Benelux Union Semiconductor Intellectual Property Market Revenue (US$ Mn) and Forecasts, By Application
13.6.7.4.1.Healthcare
13.6.7.4.2.Automotive
13.6.7.4.3.Consumer Electronics
13.6.7.4.4.Telecommunications
13.6.7.4.5.Others
13.6.7.5.Benelux Union Semiconductor Intellectual Property Market Revenue (US$ Mn) and Forecasts, By Country
13.6.7.5.1.Belgium
13.6.7.5.2.The Netherlands
13.6.7.5.3.Luxembourg
13.6.8.Rest of Europe
13.6.8.1.Rest of Europe Semiconductor Intellectual Property Market Revenue (US$ Mn) and Forecasts, By IP Core
13.6.8.1.1.Soft
13.6.8.1.2.Hard
13.6.8.2.Rest of Europe Semiconductor Intellectual Property Market Revenue (US$ Mn) and Forecasts, By Type
13.6.8.2.1.Processor IP
13.6.8.2.2.Interface IP
13.6.8.2.3.Memory IP
13.6.8.2.4.Microcontroller IP
13.6.8.2.5.Communication IP
13.6.8.2.6.Foundation IP
13.6.8.2.7.Analog IP
13.6.8.2.8.Security IP
13.6.8.2.9.Others
13.6.8.3.Rest of Europe Semiconductor Intellectual Property Market Revenue (US$ Mn) and Forecasts, By Model
13.6.8.3.1.Per Use
13.6.8.3.2.Time Based
13.6.8.3.3.Royalty Based
13.6.8.3.4.Access Based
13.6.8.4.Rest of Europe Semiconductor Intellectual Property Market Revenue (US$ Mn) and Forecasts, By Application
13.6.8.4.1.Healthcare
13.6.8.4.2.Automotive
13.6.8.4.3.Consumer Electronics
13.6.8.4.4.Telecommunications
13.6.8.4.5.Others
13.7.Key Segment for Channeling Investments
13.7.1.By Country
13.7.2.By IP Core
13.7.3.By Type
13.7.4.By Model
13.7.5.By Application
14.Asia Pacific Semiconductor Intellectual Property Market Analysis and Forecasts, 2024 – 2034
14.1.Overview
14.1.1.Asia Pacific Semiconductor Intellectual Property Market Revenue (US$ Mn)
14.2.Asia Pacific Semiconductor Intellectual Property Market Revenue (US$ Mn) and Forecasts, By IP Core
14.2.1.Soft
14.2.2.Hard
14.3.Asia Pacific Semiconductor Intellectual Property Market Revenue (US$ Mn) and Forecasts, By Type
14.3.1.Processor IP
14.3.2.Interface IP
14.3.3.Memory IP
14.3.4.Microcontroller IP
14.3.5.Communication IP
14.3.6.Foundation IP
14.3.7.Analog IP
14.3.8.Security IP
14.3.9.Others
14.4.Asia Pacific Semiconductor Intellectual Property Market Revenue (US$ Mn) and Forecasts, By Model
14.4.1.Per Use
14.4.2.Time Based
14.4.3.Royalty Based
14.4.4.Access Based
14.5.Asia Pacific Semiconductor Intellectual Property Market Revenue (US$ Mn) and Forecasts, By Application
14.5.1.Healthcare
14.5.2.Automotive
14.5.3.Consumer Electronics
14.5.4.Telecommunications
14.5.5.Others
14.6.Asia Pacific Semiconductor Intellectual Property Market Revenue (US$ Mn) and Forecasts, By Country
14.6.1.China
14.6.1.1.China Semiconductor Intellectual Property Market Revenue (US$ Mn) and Forecasts, By IP Core
14.6.1.1.1.Soft
14.6.1.1.2.Hard
14.6.1.2.China Semiconductor Intellectual Property Market Revenue (US$ Mn) and Forecasts, By Type
14.6.1.2.1.Processor IP
14.6.1.2.2.Interface IP
14.6.1.2.3.Memory IP
14.6.1.2.4.Microcontroller IP
14.6.1.2.5.Communication IP
14.6.1.2.6.Foundation IP
14.6.1.2.7.Analog IP
14.6.1.2.8.Security IP
14.6.1.2.9.Others
14.6.1.3.China Semiconductor Intellectual Property Market Revenue (US$ Mn) and Forecasts, By Model
14.6.1.3.1.Per Use
14.6.1.3.2.Time Based
14.6.1.3.3.Royalty Based
14.6.1.3.4.Access Based
14.6.1.4.China Semiconductor Intellectual Property Market Revenue (US$ Mn) and Forecasts, By Application
14.6.1.4.1.Healthcare
14.6.1.4.2.Automotive
14.6.1.4.3.Consumer Electronics
14.6.1.4.4.Telecommunications
14.6.1.4.5.Others
14.6.2.Japan
14.6.2.1.Japan Semiconductor Intellectual Property Market Revenue (US$ Mn) and Forecasts, By IP Core
14.6.2.1.1.Soft
14.6.2.1.2.Hard
14.6.2.2.Japan Semiconductor Intellectual Property Market Revenue (US$ Mn) and Forecasts, By Type
14.6.2.2.1.Processor IP
14.6.2.2.2.Interface IP
14.6.2.2.3.Memory IP
14.6.2.2.4.Microcontroller IP
14.6.2.2.5.Communication IP
14.6.2.2.6.Foundation IP
14.6.2.2.7.Analog IP
14.6.2.2.8.Security IP
14.6.2.2.9.Others
14.6.2.3.Japan Semiconductor Intellectual Property Market Revenue (US$ Mn) and Forecasts, By Model
14.6.2.3.1.Per Use
14.6.2.3.2.Time Based
14.6.2.3.3.Royalty Based
14.6.2.3.4.Access Based
14.6.2.4.Japan Semiconductor Intellectual Property Market Revenue (US$ Mn) and Forecasts, By Application
14.6.2.4.1.Healthcare
14.6.2.4.2.Automotive
14.6.2.4.3.Consumer Electronics
14.6.2.4.4.Telecommunications
14.6.2.4.5.Others
14.6.3.India
14.6.3.1.India Semiconductor Intellectual Property Market Revenue (US$ Mn) and Forecasts, By IP Core
14.6.3.1.1.Soft
14.6.3.1.2.Hard
14.6.3.2.India Semiconductor Intellectual Property Market Revenue (US$ Mn) and Forecasts, By Type
14.6.3.2.1.Processor IP
14.6.3.2.2.Interface IP
14.6.3.2.3.Memory IP
14.6.3.2.4.Microcontroller IP
14.6.3.2.5.Communication IP
14.6.3.2.6.Foundation IP
14.6.3.2.7.Analog IP
14.6.3.2.8.Security IP
14.6.3.2.9.Others
14.6.3.3.India Semiconductor Intellectual Property Market Revenue (US$ Mn) and Forecasts, By Model
14.6.3.3.1.Per Use
14.6.3.3.2.Time Based
14.6.3.3.3.Royalty Based
14.6.3.3.4.Access Based
14.6.3.4.India Semiconductor Intellectual Property Market Revenue (US$ Mn) and Forecasts, By Application
14.6.3.4.1.Healthcare
14.6.3.4.2.Automotive
14.6.3.4.3.Consumer Electronics
14.6.3.4.4.Telecommunications
14.6.3.4.5.Others
14.6.4.New Zealand
14.6.4.1.New Zealand Semiconductor Intellectual Property Market Revenue (US$ Mn) and Forecasts, By IP Core
14.6.4.1.1.Soft
14.6.4.1.2.Hard
14.6.4.2.New Zealand Semiconductor Intellectual Property Market Revenue (US$ Mn) and Forecasts, By Type
14.6.4.2.1.Processor IP
14.6.4.2.2.Interface IP
14.6.4.2.3.Memory IP
14.6.4.2.4.Microcontroller IP
14.6.4.2.5.Communication IP
14.6.4.2.6.Foundation IP
14.6.4.2.7.Analog IP
14.6.4.2.8.Security IP
14.6.4.2.9.Others
14.6.4.3.New Zealand Semiconductor Intellectual Property Market Revenue (US$ Mn) and Forecasts, By Model
14.6.4.3.1.Per Use
14.6.4.3.2.Time Based
14.6.4.3.3.Royalty Based
14.6.4.3.4.Access Based
14.6.4.4.New Zealand Semiconductor Intellectual Property Market Revenue (US$ Mn) and Forecasts, By Application
14.6.4.4.1.Healthcare
14.6.4.4.2.Automotive
14.6.4.4.3.Consumer Electronics
14.6.4.4.4.Telecommunications
14.6.4.4.5.Others
14.6.5.Australia
14.6.5.1.Australia Semiconductor Intellectual Property Market Revenue (US$ Mn) and Forecasts, By IP Core
14.6.5.1.1.Soft
14.6.5.1.2.Hard
14.6.5.2.Australia Semiconductor Intellectual Property Market Revenue (US$ Mn) and Forecasts, By Type
14.6.5.2.1.Processor IP
14.6.5.2.2.Interface IP
14.6.5.2.3.Memory IP
14.6.5.2.4.Microcontroller IP
14.6.5.2.5.Communication IP
14.6.5.2.6.Foundation IP
14.6.5.2.7.Analog IP
14.6.5.2.8.Security IP
14.6.5.2.9.Others
14.6.5.3.Australia Semiconductor Intellectual Property Market Revenue (US$ Mn) and Forecasts, By Model
14.6.5.3.1.Per Use
14.6.5.3.2.Time Based
14.6.5.3.3.Royalty Based
14.6.5.3.4.Access Based
14.6.5.4.Australia Semiconductor Intellectual Property Market Revenue (US$ Mn) and Forecasts, By Application
14.6.5.4.1.Healthcare
14.6.5.4.2.Automotive
14.6.5.4.3.Consumer Electronics
14.6.5.4.4.Telecommunications
14.6.5.4.5.Others
14.6.6.South Korea
14.6.6.1.South Korea Semiconductor Intellectual Property Market Revenue (US$ Mn) and Forecasts, By IP Core
14.6.6.1.1.Soft
14.6.6.1.2.Hard
14.6.6.2.South Korea Semiconductor Intellectual Property Market Revenue (US$ Mn) and Forecasts, By Type
14.6.6.2.1.Processor IP
14.6.6.2.2.Interface IP
14.6.6.2.3.Memory IP
14.6.6.2.4.Microcontroller IP
14.6.6.2.5.Communication IP
14.6.6.2.6.Foundation IP
14.6.6.2.7.Analog IP
14.6.6.2.8.Security IP
14.6.6.2.9.Others
14.6.6.3.South Korea Semiconductor Intellectual Property Market Revenue (US$ Mn) and Forecasts, By Model
14.6.6.3.1.Per Use
14.6.6.3.2.Time Based
14.6.6.3.3.Royalty Based
14.6.6.3.4.Access Based
14.6.6.4.South Korea Semiconductor Intellectual Property Market Revenue (US$ Mn) and Forecasts, By Application
14.6.6.4.1.Healthcare
14.6.6.4.2.Automotive
14.6.6.4.3.Consumer Electronics
14.6.6.4.4.Telecommunications
14.6.6.4.5.Others
14.6.7.Southeast Asia
14.6.7.1.Southeast Asia Semiconductor Intellectual Property Market Revenue (US$ Mn) and Forecasts, By IP Core
14.6.7.1.1.Soft
14.6.7.1.2.Hard
14.6.7.2.Southeast Asia Semiconductor Intellectual Property Market Revenue (US$ Mn) and Forecasts, By Type
14.6.7.2.1.Processor IP
14.6.7.2.2.Interface IP
14.6.7.2.3.Memory IP
14.6.7.2.4.Microcontroller IP
14.6.7.2.5.Communication IP
14.6.7.2.6.Foundation IP
14.6.7.2.7.Analog IP
14.6.7.2.8.Security IP
14.6.7.2.9.Others
14.6.7.3.Southeast Asia Semiconductor Intellectual Property Market Revenue (US$ Mn) and Forecasts, By Model
14.6.7.3.1.Per Use
14.6.7.3.2.Time Based
14.6.7.3.3.Royalty Based
14.6.7.3.4.Access Based
14.6.7.4.Southeast Asia Semiconductor Intellectual Property Market Revenue (US$ Mn) and Forecasts, By Application
14.6.7.4.1.Healthcare
14.6.7.4.2.Automotive
14.6.7.4.3.Consumer Electronics
14.6.7.4.4.Telecommunications
14.6.7.4.5.Others
14.6.7.5.Southeast Asia Semiconductor Intellectual Property Market Revenue (US$ Mn) and Forecasts, By Country
14.6.7.5.1.Indonesia
14.6.7.5.2.Thailand
14.6.7.5.3.Malaysia
14.6.7.5.4.Singapore
14.6.7.5.5.Rest of Southeast Asia
14.6.8.Rest of Asia Pacific
14.6.8.1.Rest of Asia Pacific Semiconductor Intellectual Property Market Revenue (US$ Mn) and Forecasts, By IP Core
14.6.8.1.1.Soft
14.6.8.1.2.Hard
14.6.8.2.Rest of Asia Pacific Semiconductor Intellectual Property Market Revenue (US$ Mn) and Forecasts, By Type
14.6.8.2.1.Processor IP
14.6.8.2.2.Interface IP
14.6.8.2.3.Memory IP
14.6.8.2.4.Microcontroller IP
14.6.8.2.5.Communication IP
14.6.8.2.6.Foundation IP
14.6.8.2.7.Analog IP
14.6.8.2.8.Security IP
14.6.8.2.9.Others
14.6.8.3.Rest of Asia Pacific Semiconductor Intellectual Property Market Revenue (US$ Mn) and Forecasts, By Model
14.6.8.3.1.Per Use
14.6.8.3.2.Time Based
14.6.8.3.3.Royalty Based
14.6.8.3.4.Access Based
14.6.8.4.Rest of Asia Pacific Semiconductor Intellectual Property Market Revenue (US$ Mn) and Forecasts, By Application
14.6.8.4.1.Healthcare
14.6.8.4.2.Automotive
14.6.8.4.3.Consumer Electronics
14.6.8.4.4.Telecommunications
14.6.8.4.5.Others
14.7.Key Segment for Channeling Investments
14.7.1.By Country
14.7.2.By IP Core
14.7.3.By Type
14.7.4.By Model
14.7.5.By Application
15.Middle East and Africa Semiconductor Intellectual Property Market Analysis and Forecasts, 2024 – 2034
15.1.Overview
15.1.1.Middle East and Africa Semiconductor Intellectual Property Market Revenue (US$ Mn)
15.2.Middle East and Africa Semiconductor Intellectual Property Market Revenue (US$ Mn) and Forecasts, By IP Core
15.2.1.Soft
15.2.2.Hard
15.3.Middle East and Africa Semiconductor Intellectual Property Market Revenue (US$ Mn) and Forecasts, By Type
15.3.1.Processor IP
15.3.2.Interface IP
15.3.3.Memory IP
15.3.4.Microcontroller IP
15.3.5.Communication IP
15.3.6.Foundation IP
15.3.7.Analog IP
15.3.8.Security IP
15.3.9.Others
15.4.Middle East and Africa Semiconductor Intellectual Property Market Revenue (US$ Mn) and Forecasts, By Model
15.4.1.Per Use
15.4.2.Time Based
15.4.3.Royalty Based
15.4.4.Access Based
15.5.Middle East and Africa Semiconductor Intellectual Property Market Revenue (US$ Mn) and Forecasts, By Application
15.5.1.Healthcare
15.5.2.Automotive
15.5.3.Consumer Electronics
15.5.4.Telecommunications
15.5.5.Others
15.6.Middle East and Africa Semiconductor Intellectual Property Market Revenue (US$ Mn) and Forecasts, By Country
15.6.1.Saudi Arabia
15.6.1.1.Saudi Arabia Semiconductor Intellectual Property Market Revenue (US$ Mn) and Forecasts, By IP Core
15.6.1.1.1.Soft
15.6.1.1.2.Hard
15.6.1.2.Saudi Arabia Semiconductor Intellectual Property Market Revenue (US$ Mn) and Forecasts, By Type
15.6.1.2.1.Processor IP
15.6.1.2.2.Interface IP
15.6.1.2.3.Memory IP
15.6.1.2.4.Microcontroller IP
15.6.1.2.5.Communication IP
15.6.1.2.6.Foundation IP
15.6.1.2.7.Analog IP
15.6.1.2.8.Security IP
15.6.1.2.9.Others
15.6.1.3.Saudi Arabia Semiconductor Intellectual Property Market Revenue (US$ Mn) and Forecasts, By Model
15.6.1.3.1.Per Use
15.6.1.3.2.Time Based
15.6.1.3.3.Royalty Based
15.6.1.3.4.Access Based
15.6.1.4.Saudi Arabia Semiconductor Intellectual Property Market Revenue (US$ Mn) and Forecasts, By Application
15.6.1.4.1.Healthcare
15.6.1.4.2.Automotive
15.6.1.4.3.Consumer Electronics
15.6.1.4.4.Telecommunications
15.6.1.4.5.Others
15.6.2.UAE
15.6.2.1.UAE Semiconductor Intellectual Property Market Revenue (US$ Mn) and Forecasts, By IP Core
15.6.2.1.1.Soft
15.6.2.1.2.Hard
15.6.2.2.UAE Semiconductor Intellectual Property Market Revenue (US$ Mn) and Forecasts, By Type
15.6.2.2.1.Processor IP
15.6.2.2.2.Interface IP
15.6.2.2.3.Memory IP
15.6.2.2.4.Microcontroller IP
15.6.2.2.5.Communication IP
15.6.2.2.6.Foundation IP
15.6.2.2.7.Analog IP
15.6.2.2.8.Security IP
15.6.2.2.9.Others
15.6.2.3.UAE Semiconductor Intellectual Property Market Revenue (US$ Mn) and Forecasts, By Model
15.6.2.3.1.Per Use
15.6.2.3.2.Time Based
15.6.2.3.3.Royalty Based
15.6.2.3.4.Access Based
15.6.2.4.UAE Semiconductor Intellectual Property Market Revenue (US$ Mn) and Forecasts, By Application
15.6.2.4.1.Healthcare
15.6.2.4.2.Automotive
15.6.2.4.3.Consumer Electronics
15.6.2.4.4.Telecommunications
15.6.2.4.5.Others
15.6.3.Egypt
15.6.3.1.Egypt Semiconductor Intellectual Property Market Revenue (US$ Mn) and Forecasts, By IP Core
15.6.3.1.1.Soft
15.6.3.1.2.Hard
15.6.3.2.Egypt Semiconductor Intellectual Property Market Revenue (US$ Mn) and Forecasts, By Type
15.6.3.2.1.Processor IP
15.6.3.2.2.Interface IP
15.6.3.2.3.Memory IP
15.6.3.2.4.Microcontroller IP
15.6.3.2.5.Communication IP
15.6.3.2.6.Foundation IP
15.6.3.2.7.Analog IP
15.6.3.2.8.Security IP
15.6.3.2.9.Others
15.6.3.3.Egypt Semiconductor Intellectual Property Market Revenue (US$ Mn) and Forecasts, By Model
15.6.3.3.1.Per Use
15.6.3.3.2.Time Based
15.6.3.3.3.Royalty Based
15.6.3.3.4.Access Based
15.6.3.4.Egypt Semiconductor Intellectual Property Market Revenue (US$ Mn) and Forecasts, By Application
15.6.3.4.1.Healthcare
15.6.3.4.2.Automotive
15.6.3.4.3.Consumer Electronics
15.6.3.4.4.Telecommunications
15.6.3.4.5.Others
15.6.4.Kuwait
15.6.4.1.Kuwait Semiconductor Intellectual Property Market Revenue (US$ Mn) and Forecasts, By IP Core
15.6.4.1.1.Soft
15.6.4.1.2.Hard
15.6.4.2.Kuwait Semiconductor Intellectual Property Market Revenue (US$ Mn) and Forecasts, By Type
15.6.4.2.1.Processor IP
15.6.4.2.2.Interface IP
15.6.4.2.3.Memory IP
15.6.4.2.4.Microcontroller IP
15.6.4.2.5.Communication IP
15.6.4.2.6.Foundation IP
15.6.4.2.7.Analog IP
15.6.4.2.8.Security IP
15.6.4.2.9.Others
15.6.4.3.Kuwait Semiconductor Intellectual Property Market Revenue (US$ Mn) and Forecasts, By Model
15.6.4.3.1.Per Use
15.6.4.3.2.Time Based
15.6.4.3.3.Royalty Based
15.6.4.3.4.Access Based
15.6.4.4.Kuwait Semiconductor Intellectual Property Market Revenue (US$ Mn) and Forecasts, By Application
15.6.4.4.1.Healthcare
15.6.4.4.2.Automotive
15.6.4.4.3.Consumer Electronics
15.6.4.4.4.Telecommunications
15.6.4.4.5.Others
15.6.5.South Africa
15.6.5.1.South Africa Semiconductor Intellectual Property Market Revenue (US$ Mn) and Forecasts, By IP Core
15.6.5.1.1.Soft
15.6.5.1.2.Hard
15.6.5.2.South Africa Semiconductor Intellectual Property Market Revenue (US$ Mn) and Forecasts, By Type
15.6.5.2.1.Processor IP
15.6.5.2.2.Interface IP
15.6.5.2.3.Memory IP
15.6.5.2.4.Microcontroller IP
15.6.5.2.5.Communication IP
15.6.5.2.6.Foundation IP
15.6.5.2.7.Analog IP
15.6.5.2.8.Security IP
15.6.5.2.9.Others
15.6.5.3.South Africa Semiconductor Intellectual Property Market Revenue (US$ Mn) and Forecasts, By Model
15.6.5.3.1.Per Use
15.6.5.3.2.Time Based
15.6.5.3.3.Royalty Based
15.6.5.3.4.Access Based
15.6.5.4.South Africa Semiconductor Intellectual Property Market Revenue (US$ Mn) and Forecasts, By Application
15.6.5.4.1.Healthcare
15.6.5.4.2.Automotive
15.6.5.4.3.Consumer Electronics
15.6.5.4.4.Telecommunications
15.6.5.4.5.Others
15.6.6.Rest of Middle East & Africa
15.6.6.1.Rest of Middle East & Africa Semiconductor Intellectual Property Market Revenue (US$ Mn) and Forecasts, By IP Core
15.6.6.1.1.Soft
15.6.6.1.2.Hard
15.6.6.2.Rest of Middle East & Africa Semiconductor Intellectual Property Market Revenue (US$ Mn) and Forecasts, By Type
15.6.6.2.1.Processor IP
15.6.6.2.2.Interface IP
15.6.6.2.3.Memory IP
15.6.6.2.4.Microcontroller IP
15.6.6.2.5.Communication IP
15.6.6.2.6.Foundation IP
15.6.6.2.7.Analog IP
15.6.6.2.8.Security IP
15.6.6.2.9.Others
15.6.6.3.Rest of Middle East & Africa Semiconductor Intellectual Property Market Revenue (US$ Mn) and Forecasts, By Model
15.6.6.3.1.Per Use
15.6.6.3.2.Time Based
15.6.6.3.3.Royalty Based
15.6.6.3.4.Access Based
15.6.6.4.Rest of Middle East & Africa Semiconductor Intellectual Property Market Revenue (US$ Mn) and Forecasts, By Application
15.6.6.4.1.Healthcare
15.6.6.4.2.Automotive
15.6.6.4.3.Consumer Electronics
15.6.6.4.4.Telecommunications
15.6.6.4.5.Others
15.7.Key Segment for Channeling Investments
15.7.1.By Country
15.7.2.By IP Core
15.7.3.By Type
15.7.4.By Model
15.7.5.By Application
16.Latin America Semiconductor Intellectual Property Market Analysis and Forecasts, 2024 – 2034
16.1.Overview
16.1.1.Latin America Semiconductor Intellectual Property Market Revenue (US$ Mn)
16.2.Latin America Semiconductor Intellectual Property Market Revenue (US$ Mn) and Forecasts, By IP Core
16.2.1.Soft
16.2.2.Hard
16.3.Latin America Semiconductor Intellectual Property Market Revenue (US$ Mn) and Forecasts, By Type
16.3.1.Processor IP
16.3.2.Interface IP
16.3.3.Memory IP
16.3.4.Microcontroller IP
16.3.5.Communication IP
16.3.6.Foundation IP
16.3.7.Analog IP
16.3.8.Security IP
16.3.9.Others
16.4.Latin America Semiconductor Intellectual Property Market Revenue (US$ Mn) and Forecasts, By Model
16.4.1.Per Use
16.4.2.Time Based
16.4.3.Royalty Based
16.4.4.Access Based
16.5.Latin America Semiconductor Intellectual Property Market Revenue (US$ Mn) and Forecasts, By Application
16.5.1.Healthcare
16.5.2.Automotive
16.5.3.Consumer Electronics
16.5.4.Telecommunications
16.5.5.Others
16.6.Latin America Semiconductor Intellectual Property Market Revenue (US$ Mn) and Forecasts, By Country
16.6.1.Brazil
16.6.1.1.Brazil Semiconductor Intellectual Property Market Revenue (US$ Mn) and Forecasts, By IP Core
16.6.1.1.1.Soft
16.6.1.1.2.Hard
16.6.1.2.Brazil Semiconductor Intellectual Property Market Revenue (US$ Mn) and Forecasts, By Type
16.6.1.2.1.Processor IP
16.6.1.2.2.Interface IP
16.6.1.2.3.Memory IP
16.6.1.2.4.Microcontroller IP
16.6.1.2.5.Communication IP
16.6.1.2.6.Foundation IP
16.6.1.2.7.Analog IP
16.6.1.2.8.Security IP
16.6.1.2.9.Others
16.6.1.3.Brazil Semiconductor Intellectual Property Market Revenue (US$ Mn) and Forecasts, By Model
16.6.1.3.1.Per Use
16.6.1.3.2.Time Based
16.6.1.3.3.Royalty Based
16.6.1.3.4.Access Based
16.6.1.4.Brazil Semiconductor Intellectual Property Market Revenue (US$ Mn) and Forecasts, By Application
16.6.1.4.1.Healthcare
16.6.1.4.2.Automotive
16.6.1.4.3.Consumer Electronics
16.6.1.4.4.Telecommunications
16.6.1.4.5.Others
16.6.2.Argentina
16.6.2.1.Argentina Semiconductor Intellectual Property Market Revenue (US$ Mn) and Forecasts, By IP Core
16.6.2.1.1.Soft
16.6.2.1.2.Hard
16.6.2.2.Argentina Semiconductor Intellectual Property Market Revenue (US$ Mn) and Forecasts, By Type
16.6.2.2.1.Processor IP
16.6.2.2.2.Interface IP
16.6.2.2.3.Memory IP
16.6.2.2.4.Microcontroller IP
16.6.2.2.5.Communication IP
16.6.2.2.6.Foundation IP
16.6.2.2.7.Analog IP
16.6.2.2.8.Security IP
16.6.2.2.9.Others
16.6.2.3.Argentina Semiconductor Intellectual Property Market Revenue (US$ Mn) and Forecasts, By Model
16.6.2.3.1.Per Use
16.6.2.3.2.Time Based
16.6.2.3.3.Royalty Based
16.6.2.3.4.Access Based
16.6.2.4.Argentina Semiconductor Intellectual Property Market Revenue (US$ Mn) and Forecasts, By Application
16.6.2.4.1.Healthcare
16.6.2.4.2.Automotive
16.6.2.4.3.Consumer Electronics
16.6.2.4.4.Telecommunications
16.6.2.4.5.Others
16.6.3.Rest of Latin America
16.6.3.1.Rest of Latin America Semiconductor Intellectual Property Market Revenue (US$ Mn) and Forecasts, By IP Core
16.6.3.1.1.Soft
16.6.3.1.2.Hard
16.6.3.2.Rest of Latin America Semiconductor Intellectual Property Market Revenue (US$ Mn) and Forecasts, By Type
16.6.3.2.1.Processor IP
16.6.3.2.2.Interface IP
16.6.3.2.3.Memory IP
16.6.3.2.4.Microcontroller IP
16.6.3.2.5.Communication IP
16.6.3.2.6.Foundation IP
16.6.3.2.7.Analog IP
16.6.3.2.8.Security IP
16.6.3.2.9.Others
16.6.3.3.Rest of Latin America Semiconductor Intellectual Property Market Revenue (US$ Mn) and Forecasts, By Model
16.6.3.3.1.Per Use
16.6.3.3.2.Time Based
16.6.3.3.3.Royalty Based
16.6.3.3.4.Access Based
16.6.3.4.Rest of Latin America Semiconductor Intellectual Property Market Revenue (US$ Mn) and Forecasts, By Application
16.6.3.4.1.Healthcare
16.6.3.4.2.Automotive
16.6.3.4.3.Consumer Electronics
16.6.3.4.4.Telecommunications
16.6.3.4.5.Others
16.7.Key Segment for Channeling Investments
16.7.1.By Country
16.7.2.By IP Core
16.7.3.By Type
16.7.4.By Model
16.7.5.By Application
17.Competitive Benchmarking
17.1.Brand Benchmarking
17.2.Market Share Analysis, 2023
17.3.Global Presence and Growth Strategies
17.3.1.Mergers and Acquisitions
17.3.2.Product Launches
17.3.3.Investments Trends
17.3.4.R&D Initiatives
18.Player Profiles
18.1.ALPHAWAVE SEMI
18.1.1.Company Details
18.1.2.Company Overview
18.1.3.Product Offerings
18.1.4.Key Developments
18.1.5.Financial Analysis
18.1.6.SWOT Analysis
18.1.7.Business Strategies
18.2.Analog Bits
18.2.1.Company Details
18.2.2.Company Overview
18.2.3.Product Offerings
18.2.4.Key Developments
18.2.5.Financial Analysis
18.2.6.SWOT Analysis
18.2.7.Business Strategies
18.3.Arm Limited
18.3.1.Company Details
18.3.2.Company Overview
18.3.3.Product Offerings
18.3.4.Key Developments
18.3.5.Financial Analysis
18.3.6.SWOT Analysis
18.3.7.Business Strategies
18.4.ARTERIS, INC
18.4.1.Company Details
18.4.2.Company Overview
18.4.3.Product Offerings
18.4.4.Key Developments
18.4.5.Financial Analysis
18.4.6.SWOT Analysis
18.4.7.Business Strategies
18.5.Cadence Design Systems, Inc.
18.5.1.Company Details
18.5.2.Company Overview
18.5.3.Product Offerings
18.5.4.Key Developments
18.5.5.Financial Analysis
18.5.6.SWOT Analysis
18.5.7.Business Strategies
18.6.CEVA, Inc.
18.6.1.Company Details
18.6.2.Company Overview
18.6.3.Product Offerings
18.6.4.Key Developments
18.6.5.Financial Analysis
18.6.6.SWOT Analysis
18.6.7.Business Strategies
18.7.Dolphin Design
18.7.1.Company Details
18.7.2.Company Overview
18.7.3.Product Offerings
18.7.4.Key Developments
18.7.5.Financial Analysis
18.7.6.SWOT Analysis
18.7.7.Business Strategies
18.8.Dream Chip Technologies GmbH
18.8.1.Company Details
18.8.2.Company Overview
18.8.3.Product Offerings
18.8.4.Key Developments
18.8.5.Financial Analysis
18.8.6.SWOT Analysis
18.8.7.Business Strategies
18.9.eMemory Technology Inc.
18.9.1.Company Details
18.9.2.Company Overview
18.9.3.Product Offerings
18.9.4.Key Developments
18.9.5.Financial Analysis
18.9.6.SWOT Analysis
18.9.7.Business Strategies
18.10.Eureka Technology, Inc
18.10.1.Company Details
18.10.2.Company Overview
18.10.3.Product Offerings
18.10.4.Key Developments
18.10.5.Financial Analysis
18.10.6.SWOT Analysis
18.10.7.Business Strategies
18.11.Frontgrade Gaisler
18.11.1.Company Details
18.11.2.Company Overview
18.11.3.Product Offerings
18.11.4.Key Developments
18.11.5.Financial Analysis
18.11.6.SWOT Analysis
18.11.7.Business Strategies
18.12.Imagination Technologies
18.12.1.Company Details
18.12.2.Company Overview
18.12.3.Product Offerings
18.12.4.Key Developments
18.12.5.Financial Analysis
18.12.6.SWOT Analysis
18.12.7.Business Strategies
18.13.Lattice Semiconductor
18.13.1.Company Details
18.13.2.Company Overview
18.13.3.Product Offerings
18.13.4.Key Developments
18.13.5.Financial Analysis
18.13.6.SWOT Analysis
18.13.7.Business Strategies
18.14.Rambus
18.14.1.Company Details
18.14.2.Company Overview
18.14.3.Product Offerings
18.14.4.Key Developments
18.14.5.Financial Analysis
18.14.6.SWOT Analysis
18.14.7.Business Strategies
18.15.Synopsys, Inc. 
18.15.1.Company Details
18.15.2.Company Overview
18.15.3.Product Offerings
18.15.4.Key Developments
18.15.5.Financial Analysis
18.15.6.SWOT Analysis
18.15.7.Business Strategies
18.16.TOPPAN Holdings Inc.
18.16.1.Company Details
18.16.2.Company Overview
18.16.3.Product Offerings
18.16.4.Key Developments
18.16.5.Financial Analysis
18.16.6.SWOT Analysis
18.16.7.Business Strategies
18.17.VeriSilicon
18.17.1.Company Details
18.17.2.Company Overview
18.17.3.Product Offerings
18.17.4.Key Developments
18.17.5.Financial Analysis
18.17.6.SWOT Analysis
18.17.7.Business Strategies
18.18.Other Industry Participants
19.Key Findings

.

.

Note: This ToC is tentative and can be changed according to the research study conducted during the course of report completion.

.

**Exclusive for Multi-User and Enterprise User.

.

.

Global Semiconductor Intellectual Property Market

By IP Core

  • Soft
  • Hard

By Type

  • Processor IP
  • Interface IP
  • Memory IP
  • Microcontroller IP
  • Communication IP
  • Foundation IP
  • Analog IP
  • Security IP
  • Other IP

By Model

  • Per Use
  • Time Based
  • Royalty Based
  • Access Based

By Application

  • Healthcare
  • Automotive
  • Consumer Electronics
  • Telecommunications
  • Others

By Region

  • North America (U.S., Canada, Mexico, Rest of North America)
  • Europe (France, The UK, Spain, Germany, Italy, Nordic Countries (Denmark, Finland, Iceland, Sweden, Norway), Benelux Union (Belgium, The Netherlands, Luxembourg), Rest of Europe)
  • Asia Pacific (China, Japan, India, New Zealand, Australia, South Korea, Southeast Asia (Indonesia, Thailand, Malaysia, Singapore, Rest of Southeast Asia), Rest of Asia Pacific)
  • Middle East & Africa (Saudi Arabia, UAE, Egypt, Kuwait, South Africa, Rest of Middle East & Africa)
  • Latin America (Brazil, Argentina, Rest of Latin America)

.

The Niche Research approach encompasses both primary and secondary research methods to provide comprehensive insights. While primary research is the cornerstone of our studies, we also incorporate secondary research sources such as company annual reports, premium industry databases, press releases, industry journals, and white papers.

Within our primary research, we actively engage with various industry stakeholders, conducting paid interviews and surveys. Our meticulous analysis extends to every market participant in major countries, allowing us to thoroughly examine their portfolios, calculate market shares, and segment revenues.

Our data collection primarily focuses on individual countries within our research scope, enabling us to estimate regional market sizes. Typically, we employ a bottom-up approach, meticulously tracking trends in different countries. We analyze growth drivers, constraints, technological innovations, and opportunities for each country, ultimately arriving at regional figures.Our process begins by examining the growth prospects of each country. Building upon these insights, we project growth and trends for the entire region. Finally, we utilize our proprietary model to refine estimations and forecasts.

Our data validation standards are integral to ensuring the reliability and accuracy of our research findings. Here’s a breakdown of our data validation processes and the stakeholders we engage with during our primary research:

  • Supply Side Analysis: We initiate a supply side analysis by directly contacting market participants, through telephonic interviews and questionnaires containing both open-ended and close-ended questions. We gather information on their portfolios, segment revenues, developments, and growth strategies.
  • Demand Side Analysis: To gain insights into adoption trends and consumer preferences, we reach out to target customers and users (non-vendors). This information forms a vital part of the qualitative analysis section of our reports, covering market dynamics, adoption trends, consumer behavior, spending patterns, and other related aspects.
  • Consultant Insights: We tap into the expertise of our partner consultants from around the world to obtain their unique viewpoints and perspectives. Their insights contribute to a well-rounded understanding of the markets under investigation.
  • In-House Validation: To ensure data accuracy and reliability, we conduct cross-validation of data points and information through our in-house team of consultants and utilize advanced data modeling tools for thorough verification.

The forecasts we provide are based on a comprehensive assessment of various factors, including:

  • Market Trends and Past Performance (Last Five Years): We accurately analyze market trends and performance data from preceding five years to identify historical patterns and understand the market’s evolution.
  • Historical Performance and Growth of Market Participants: We assess the historical performance and growth trajectories of key market participants. This analysis provides insights into the competitive landscape and individual company strategies.
  • Market Determinants Impact Analysis (Next Eight Years): We conduct a rigorous analysis of the factors that are projected to influence the market over the next eight years. This includes assessing both internal and external determinants that can shape market dynamics.
  • Drivers and Challenges for the Forecast Period:Identify the factors expected to drive market growth during the forecast period, as well as the challenges that the industry may face. This analysis aids in deriving an accurate growth rate projection.
  • New Acquisitions, Collaborations, or Partnerships: We keep a close watch on any new acquisitions, collaborations, or partnerships within the industry. These developments can have a significant impact on market dynamics and competitiveness.
  • Macro and Micro Factors Analysis:A thorough examination of both macro-level factors (e.g., economic trends, regulatory changes) and micro-level factors (e.g., technological advancements, consumer preferences) that may influence the market during the forecast period.
  • End-User Sentiment Analysis: To understand the market from the end-user perspective, we conduct sentiment analysis. This involves assessing the sentiment, preferences, and feedback of the end-users, which can provide valuable insights into market trends.
  • Perspective of Primary Participants: Insights gathered directly from primary research participants play a crucial role in shaping our forecasts. Their perspectives and experiences provide valuable qualitative data.
  • Year-on-Year Growth Trend: We utilize a year-on-year growth trend based on historical market growth and expected future trends. This helps in formulating our growth projections, aligning them with the market’s historical performance.

Research process adopted by TNR involves multiple stages, including data collection, validation, quality checks, and presentation. It’s crucial that the data and information we provide add value to your existing market understanding and expertise. We have also established partnerships with business consulting, research, and survey organizations across regions and globally to collaborate on regional analysis and data validation, ensuring the highest level of accuracy and reliability in our reports.


Procure Comprehensive Study of

Global Semiconductor Intellectual Property Market

Online Only

  • Online Access
  • Read Only File
  • Validity 3 Months
  • Print, Copy, Paste & Download
  • PPT, Excel
  • Cost-Free Report in the Next Update
$3300
Buy Now

Single User

  • Access to One User on One System
  • Read Only File
  • Validity 6 Months
  • Limited Print,Copy, Paste
  • PPT, Excel
  • Cost-Free Report in the Next Update
$4200
Buy Now

Multi User

  • Access to Fiver Users
  • PDF File
  • Validity 1 Year
  • Upto FivePrints
  • Cost-Free Report in the Next Update
  • PPT, Excel
$6000
Buy Now

Enterprise User

  • Access to Unlimited Users
  • PDF, PPT, Excel
  • Unlimited Validity, Prints&Downloads
  • 1 Hour Cost-Free & Dedicated Analyst Support
  • 10% Cost-Free Customization
  • Cost-Free Report Update Twice in a Year
  • Recommendations for Business Strategies
  • Authorization to Quote TNR, The Niche Research
$7300
Buy Now

Library Access

  • Online Access to Content Publications
  • Access Player Profiles Online
  • Get Immediate Access to Newly Added Content
  • Acquire 12 PDF Downloads
  • Acquire 5 Excel Data Sets
  • Gain Access to 290+ PDFs of Company Profiles
  • Round-the-clock Email and Phone Assistance
  • Dashboard Usage and Trends
  • Renewal & Upgrade Assistance
  • Assessing Customization Options and Alerts for New Reports
$10788
Buy Now
*Taxes/Fees, if applicable will be added during checkout. All prices in USD

Why TNR The Niche Research?

  • Unwavering Commitment to Excellence

  • Veteran Team of Researchers

  • Accurate and Timely Insights

  • Ethical Practices and Customized Service

  • Uninterrupted Availability Around the Clock

Scroll to Top