Global Synthetic Natural Gas Market: By Source, By Technology, By Application, By Region & Segmental Insights Trends and Forecast, 2024 – 2034

  • Industry: Energy & Power
  • Report ID: TNR-110-1092
  • Number of Pages: 420
  • Table/Charts : Yes
  • May, 2024
  • Base Year : 2024
  • No. of Companies : 10+
  • No. of Countries : 29
  • Views : 10077
  • Covid Impact Covered: Yes
  • War Impact Covered: Yes
  • Formats : PDF, Excel, PPT

Synthetic natural gas (SNG), also known as substitute natural gas or renewable natural gas, is a type of fuel produced through the conversion of various feedstocks, such as biomass, municipal solid waste, or coal, into a gas that closely resembles natural gas in terms of composition and properties. The production process typically involves gasification or anaerobic digestion followed by purification steps to remove impurities and contaminants.

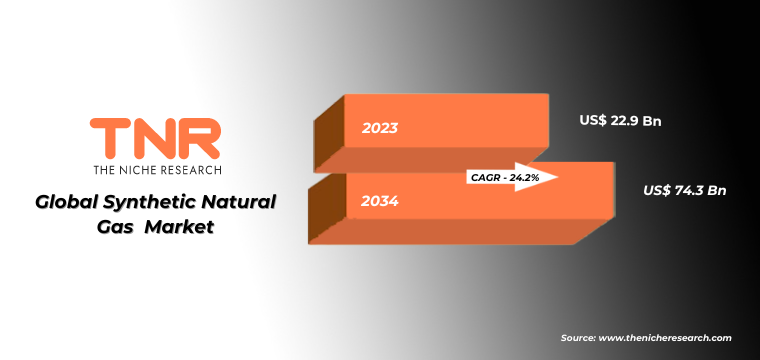
SNG offers environmental benefits over traditional fossil fuels, including reduced greenhouse gas emissions and lower air pollution. As governments worldwide implement stricter environmental regulations to combat climate change and improve air quality, the demand for cleaner energy sources such as SNG is expected to increase. Many countries have established renewable energy targets and incentives to promote the use of low-carbon and renewable fuels. SNG, when produced from biomass or other renewable feedstocks, can contribute to meeting these targets and diversifying the energy mix. SNG can serve as a flexible energy resource for grid balancing and energy storage applications, helping to stabilize the grid and manage fluctuations in renewable energy generation, such as wind and solar. Its ability to be stored and transported through existing natural gas infrastructure makes it an attractive option for energy storage. In terms of revenue, the global synthetic natural gas market was worth US$ 22.9 Bn in 2023, anticipated to witness CAGR of 24.2% During 2024 – 2034.

Global Synthetic Natural Gas Market Key Dynamics

Energy Demand and Security: The growing global demand for energy, coupled with concerns about energy security and dependence on fossil fuels, drives the need for alternative sources of natural gas. SNG offers a potential solution by providing a renewable or low-carbon substitute for traditional natural gas, reducing reliance on imports and enhancing energy security.

Renewable Energy Policies: Government initiatives and policies aimed at reducing greenhouse gas emissions and promoting renewable energy sources play a significant role in driving the adoption of SNG. Renewable energy targets, carbon pricing mechanisms, and financial incentives for renewable energy projects encourage investment in SNG production technologies, such as biomass gasification and biogas upgrading.

Environmental Regulations: Stringent environmental regulations aimed at reducing air pollution and carbon emissions incentivize the use of cleaner fuels like SNG. Policies such as carbon taxes, emissions trading schemes, and renewable energy mandates create market opportunities for SNG producers and encourage the development of technologies for carbon capture and utilization (CCU) or carbon capture and storage (CCS).

Thermal Gasification segment dominated the Global Synthetic natural gas Market During the Forecast Period (2024 – 2034).

Thermal gasification provides an opportunity to utilize a diverse range of feedstocks, including biomass, municipal solid waste, and coal, to produce SNG domestically. This reduces dependence on imported natural gas and enhances energy security by diversifying the energy mix. Government policies and incentives aimed at promoting renewable energy sources and reducing greenhouse gas emissions drive demand for SNG produced through thermal gasification. Renewable energy targets, carbon pricing mechanisms, and feed-in tariffs encourage investment in thermal gasification projects and SNG production facilities. Stringent environmental regulations, such as emissions standards and carbon pricing, incentivize the use of cleaner fuels like SNG produced from renewable or low-carbon feedstocks. Thermal gasification technologies offer the potential for carbon capture and utilization (CCU) or carbon capture and storage (CCS), further enhancing their attractiveness from an environmental perspective.

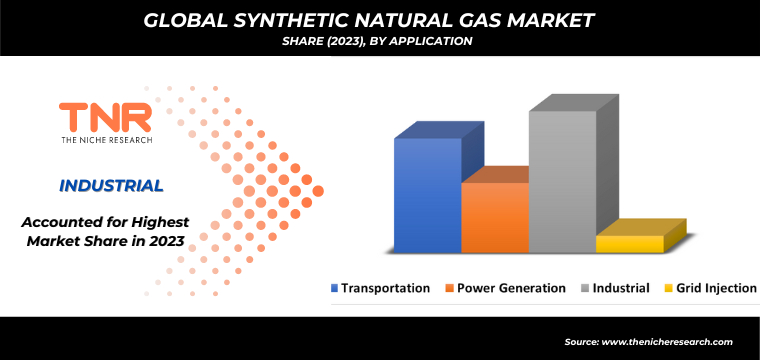
Industrial Segment had the Highest Share in the Global Synthetic natural gas Market in 2023.

Industries such as steel, cement, chemicals, and manufacturing have high energy requirements for heating, drying, and process energy. SNG provides a reliable and flexible energy source that can meet these intensive energy needs while reducing greenhouse gas emissions compared to conventional fossil fuels. Industries require a reliable and uninterrupted energy supply to maintain production processes and operations. SNG offers an alternative to traditional natural gas, reducing dependence on imported fossil fuels and enhancing energy security for industrial facilities. Stringent environmental regulations and emission standards drive industries to seek cleaner energy sources to comply with air quality and greenhouse gas emissions targets. SNG produced from renewable or low-carbon feedstocks offers a sustainable solution for reducing emissions and achieving environmental compliance.

Biomass Accounted for the Second Highest Share in the Global Synthetic Natural Gas Market in 2023.

Governments and energy utilities often set renewable energy targets to reduce reliance on fossil fuels and mitigate climate change. Biomass-derived SNG contributes to these goals by providing a renewable and sustainable alternative to natural gas, thereby diversifying the energy mix and increasing energy security. Many industries and countries have committed to achieving carbon neutrality or net-zero emissions by a certain target year. Biomass-based SNG offers a carbon-neutral energy source when produced from sustainably managed biomass feedstocks, as the carbon dioxide released during combustion is offset by the carbon dioxide absorbed during biomass growth. Biomass feedstocks for SNG production can include agricultural residues, forestry residues, organic waste materials, and dedicated energy crops. Utilizing these biomass resources for SNG production helps divert organic waste from landfills, mitigates methane emissions from decomposing organic matter, and contributes to more sustainable waste management practices.

Europe had the Highest Market Share in 2023 in the Global Synthetic Natural Gas Market.

The European Union (EU) has set ambitious renewable energy targets to reduce greenhouse gas emissions and increase the share of renewable energy in the overall energy mix. SNG produced from renewable feedstocks, such as biomass and biogas, contributes to these targets by providing a renewable and sustainable alternative to natural gas. European countries are committed to decarbonizing their economies and achieving carbon neutrality by mid-century. SNG produced from renewable feedstocks plays a crucial role in this transition by providing a low-carbon alternative to fossil fuels and helping to reduce greenhouse gas emissions in sectors such as industry, heating, and transportation.

Competitive Landscape: Global Synthetic Natural Gas Market

  • Air Liquide
  • Basin Electric Power Cooperative
  • Chevron Corporation
  • E. ON SE
  • EnviTec Biogas AG
  • Kinder Morgan
  • MAN Energy Solutions
  • OPAL Fuels
  • Total Energies
  • Verbio SE
  • Waga Energy
  • Other Market Participants

Global Synthetic Natural Gas Market Key Details:

Report Specifications Details
Market Revenue in 2023 US$ 22.9 Bn
Market Size Forecast by 2034 US$ 74.3 Bn
Growth Rate (CAGR) 24.2%
Historic Data 2016 – 2022
Base Year for Estimation 2023
Forecast Period 2024 – 2034
Report Inclusions Market Size & Estimates, Market Dynamics, Competitive Scenario, Trends, Growth Factors, Market Determinants, Key Investment Segmentation, Product/Service/Solutions Benchmarking
Segments Covered By Source, By Technology, By Application
Regions Covered North America, Europe, Asia Pacific, Middle East & Africa, Latin America
Countries Covered U.S., Canada, Mexico, Rest of North America,  France, The UK, Spain, Germany, Italy, Nordic Countries (Denmark, Finland, Iceland, Sweden, Norway), Benelux Union (Belgium, The Netherlands, Luxembourg), Rest of Europe,  China, Japan, India, New Zealand, Australia, South Korea, Southeast Asia (Indonesia, Thailand, Malaysia, Singapore, Rest of Southeast Asia), Rest of Asia Pacific,  Saudi Arabia, UAE, Egypt, Kuwait, South Africa, Rest of Middle East & Africa,  Brazil, Argentina, Rest of Latin America
Key Players Air Liquide, Basin Electric Power Cooperative, Chevron Corporation, E. ON SE, EnviTec Biogas AG, Kinder Morgan, MAN Energy Solutions, OPAL Fuels, Total Energies, Verbio SE, Waga Energy, Other Market Participants
Customization Scope Customization allows for the inclusion/modification of content pertaining to geographical regions, countries, and specific market segments.
Pricing & Procurement Options Explore purchase options tailored to your specific research requirements
Contact Details Consult With Our Expert

Japan (Toll-Free):  +81 663-386-8111

South Korea (Toll-Free):  +82-808- 703-126

Saudi Arabia (Toll-Free):  +966 800-850-1643

United Kingdom: +44 753-710-5080

United States: +1 302-232-5106

E-mail:  askanexpert@thenicheresearch.com


Global Synthetic Natural Gas Market

By Source

  • Coal
  • Biomass
  • Renewable Energy
  • Others

By Technology

  • Anaerobic digestion & fermentation
  • Thermal gasification
    • Moving bed gasifier
    • Fluidized bed gasifier
    • Entrained flow gasifier
  • Power-to-gas
  • Others

By Application

  • Transportation
  • Power Generation
  • Industrial
  • Grid Injection

By Region

  • North America (U.S., Canada, Mexico, Rest of North America)
  • Europe (France, The UK, Spain, Germany, Italy, Nordic Countries (Denmark, Finland, Iceland, Sweden, Norway), Benelux Union (Belgium, The Netherlands, Luxembourg), Rest of Europe)
  • Asia Pacific (China, Japan, India, New Zealand, Australia, South Korea, Southeast Asia (Indonesia, Thailand, Malaysia, Singapore, Rest of Southeast Asia), Rest of Asia Pacific)
  • Middle East & Africa (Saudi Arabia, UAE, Egypt, Kuwait, South Africa, Rest of Middle East & Africa)
  • Latin America (Brazil, Argentina, Rest of Latin America)

Report Coverage

Table of Contents

.

1.Market Scope
1.1.Market Segmentation
1.2.Years Considered
1.2.1.Historic Years: 2016 – 2022
1.2.2.Base Year: 2023
1.2.3.Forecast Years: 2024 – 2034
2.Key Target Audiences
3.Research Methodology
3.1.Primary Research
3.1.1.Research Questionnaire
3.1.2.Global Percentage Breakdown
3.1.3.Primary Interviews: Key Opinion Leaders (KOLs)
3.2.Secondary Research
3.2.1.Paid Databases
3.2.2.Secondary Sources
3.3.Market Size Estimates
3.3.1.Top-Down Approach
3.3.2.Bottom-Up Approach
3.4.Data Triangulation Methodology
3.5.Research Assumptions
4.Recommendations and Insights from TNR’s Perspective**
5.Holistic Overview of Synthetic Natural Gas Market
6.Market Synopsis: Synthetic Natural Gas Market
7.Synthetic Natural Gas Market Analysis: Qualitative Perspective
7.1.Introduction
7.1.1.Product Definition
7.1.2.Industry Development
7.2.Market Dynamics
7.2.1.Drivers
7.2.2.Restraints
7.2.3.Opportunities
7.2.4.Challenges
7.3.Trends in Synthetic Natural Gas Market
7.4.Market Determinants Radar Chart
7.5.Macro-Economic and Micro-Economic Indicators: Synthetic Natural Gas Market
7.6.Porter’s Five Force Analysis
7.7.Impact of Covid-19 on Synthetic Natural Gas Market
8.Global Synthetic Natural Gas Market Analysis and Forecasts, 2024 – 2034
8.1.Overview
8.1.1.Global Synthetic Natural Gas Market Revenue (US$ Mn)
8.2.Global Synthetic Natural Gas Market Revenue (US$ Mn) and Forecasts, By Source
8.2.1.Coal
8.2.1.1.Definition
8.2.1.2.Market Estimation and Penetration, 2016 – 2023
8.2.1.3.Market Forecast, 2024 – 2034
8.2.1.4.Compound Annual Growth Rate (CAGR)
8.2.1.5.Regional Bifurcation
8.2.1.5.1.North America
8.2.1.5.1.1.Market Estimation, 2016 – 2023
8.2.1.5.1.2.Market Forecast, 2024 – 2034
8.2.1.5.2.Europe
8.2.1.5.2.1.Market Estimation, 2016 – 2023
8.2.1.5.2.2.Market Forecast, 2024 – 2034
8.2.1.5.3.Asia Pacific
8.2.1.5.3.1.Market Estimation, 2016 – 2023
8.2.1.5.3.2.Market Forecast, 2024 – 2034
8.2.1.5.4.Middle East and Africa
8.2.1.5.4.1.Market Estimation, 2016 – 2023
8.2.1.5.4.2.Market Forecast, 2024 – 2034
8.2.1.5.5.Latin America
8.2.1.5.5.1.Market Estimation, 2016 – 2023
8.2.1.5.5.2.Market Forecast, 2024 – 2034
8.2.2.Biomass
8.2.2.1.Definition
8.2.2.2.Market Estimation and Penetration, 2016 – 2023
8.2.2.3.Market Forecast, 2024 – 2034
8.2.2.4.Compound Annual Growth Rate (CAGR)
8.2.2.5.Regional Bifurcation
8.2.2.5.1.North America
8.2.2.5.1.1.Market Estimation, 2016 – 2023
8.2.2.5.1.2.Market Forecast, 2024 – 2034
8.2.2.5.2.Europe
8.2.2.5.2.1.Market Estimation, 2016 – 2023
8.2.2.5.2.2.Market Forecast, 2024 – 2034
8.2.2.5.3.Asia Pacific
8.2.2.5.3.1.Market Estimation, 2016 – 2023
8.2.2.5.3.2.Market Forecast, 2024 – 2034
8.2.2.5.4.Middle East and Africa
8.2.2.5.4.1.Market Estimation, 2016 – 2023
8.2.2.5.4.2.Market Forecast, 2024 – 2034
8.2.2.5.5.Latin America
8.2.2.5.5.1.Market Estimation, 2016 – 2023
8.2.2.5.5.2.Market Forecast, 2024 – 2034
8.2.3.Renewable Energy
8.2.3.1.Definition
8.2.3.2.Market Estimation and Penetration, 2016 – 2023
8.2.3.3.Market Forecast, 2024 – 2034
8.2.3.4.Compound Annual Growth Rate (CAGR)
8.2.3.5.Regional Bifurcation
8.2.3.5.1.North America
8.2.3.5.1.1.Market Estimation, 2016 – 2023
8.2.3.5.1.2.Market Forecast, 2024 – 2034
8.2.3.5.2.Europe
8.2.3.5.2.1.Market Estimation, 2016 – 2023
8.2.3.5.2.2.Market Forecast, 2024 – 2034
8.2.3.5.3.Asia Pacific
8.2.3.5.3.1.Market Estimation, 2016 – 2023
8.2.3.5.3.2.Market Forecast, 2024 – 2034
8.2.3.5.4.Middle East and Africa
8.2.3.5.4.1.Market Estimation, 2016 – 2023
8.2.3.5.4.2.Market Forecast, 2024 – 2034
8.2.3.5.5.Latin America
8.2.3.5.5.1.Market Estimation, 2016 – 2023
8.2.3.5.5.2.Market Forecast, 2024 – 2034
8.2.4.Others
8.2.4.1.Definition
8.2.4.2.Market Estimation and Penetration, 2016 – 2023
8.2.4.3.Market Forecast, 2024 – 2034
8.2.4.4.Compound Annual Growth Rate (CAGR)
8.2.4.5.Regional Bifurcation
8.2.4.5.1.North America
8.2.4.5.1.1.Market Estimation, 2016 – 2023
8.2.4.5.1.2.Market Forecast, 2024 – 2034
8.2.4.5.2.Europe
8.2.4.5.2.1.Market Estimation, 2016 – 2023
8.2.4.5.2.2.Market Forecast, 2024 – 2034
8.2.4.5.3.Asia Pacific
8.2.4.5.3.1.Market Estimation, 2016 – 2023
8.2.4.5.3.2.Market Forecast, 2024 – 2034
8.2.4.5.4.Middle East and Africa
8.2.4.5.4.1.Market Estimation, 2016 – 2023
8.2.4.5.4.2.Market Forecast, 2024 – 2034
8.2.4.5.5.Latin America
8.2.4.5.5.1.Market Estimation, 2016 – 2023
8.2.4.5.5.2.Market Forecast, 2024 – 2034
8.3.Key Segment for Channeling Investments
8.3.1.By Source
9.Global Synthetic Natural Gas Market Analysis and Forecasts, 2024 – 2034
9.1.Overview
9.2.Global Synthetic Natural Gas Market Revenue (US$ Mn) and Forecasts, By Technology
9.2.1.Anaerobic digestion and fermentation
9.2.1.1.Definition
9.2.1.2.Market Estimation and Penetration, 2016 – 2023
9.2.1.3.Market Forecast, 2024 – 2034
9.2.1.4.Compound Annual Growth Rate (CAGR)
9.2.1.5.Regional Bifurcation
9.2.1.5.1.North America
9.2.1.5.1.1.Market Estimation, 2016 – 2023
9.2.1.5.1.2.Market Forecast, 2024 – 2034
9.2.1.5.2.Europe
9.2.1.5.2.1.Market Estimation, 2016 – 2023
9.2.1.5.2.2.Market Forecast, 2024 – 2034
9.2.1.5.3.Asia Pacific
9.2.1.5.3.1.Market Estimation, 2016 – 2023
9.2.1.5.3.2.Market Forecast, 2024 – 2034
9.2.1.5.4.Middle East and Africa
9.2.1.5.4.1.Market Estimation, 2016 – 2023
9.2.1.5.4.2.Market Forecast, 2024 – 2034
9.2.1.5.5.Latin America
9.2.1.5.5.1.Market Estimation, 2016 – 2023
9.2.1.5.5.2.Market Forecast, 2024 – 2034
9.2.2.Thermal gasification (Definition, Market Estimation and Penetration, 2016 – 2023, Market Estimation (2016 – 2023), Market Forecast (2024 – 2034), Compound Annual Growth Rate (CAGR), Regional Bifurcation (North America, Europe, Asia Pacific, Middle East and Africa, Latin America) and Information on Moving bed gasifier, Fluidized bed gasifier, Entrained flow gasifier)
9.2.2.1.Moving bed gasifier
9.2.2.2.Fluidized bed gasifier
9.2.2.3.Entrained flow gasifier
9.2.3.Power-to-gas
9.2.3.1.Definition
9.2.3.2.Market Estimation and Penetration, 2016 – 2023
9.2.3.3.Market Forecast, 2024 – 2034
9.2.3.4.Compound Annual Growth Rate (CAGR)
9.2.3.5.Regional Bifurcation
9.2.3.5.1.North America
9.2.3.5.1.1.Market Estimation, 2016 – 2023
9.2.3.5.1.2.Market Forecast, 2024 – 2034
9.2.3.5.2.Europe
9.2.3.5.2.1.Market Estimation, 2016 – 2023
9.2.3.5.2.2.Market Forecast, 2024 – 2034
9.2.3.5.3.Asia Pacific
9.2.3.5.3.1.Market Estimation, 2016 – 2023
9.2.3.5.3.2.Market Forecast, 2024 – 2034
9.2.3.5.4.Middle East and Africa
9.2.3.5.4.1.Market Estimation, 2016 – 2023
9.2.3.5.4.2.Market Forecast, 2024 – 2034
9.2.3.5.5.Latin America
9.2.3.5.5.1.Market Estimation, 2016 – 2023
9.2.3.5.5.2.Market Forecast, 2024 – 2034
9.2.4.Others
9.2.4.1.Definition
9.2.4.2.Market Estimation and Penetration, 2016 – 2023
9.2.4.3.Market Forecast, 2024 – 2034
9.2.4.4.Compound Annual Growth Rate (CAGR)
9.2.4.5.Regional Bifurcation
9.2.4.5.1.North America
9.2.4.5.1.1.Market Estimation, 2016 – 2023
9.2.4.5.1.2.Market Forecast, 2024 – 2034
9.2.4.5.2.Europe
9.2.4.5.2.1.Market Estimation, 2016 – 2023
9.2.4.5.2.2.Market Forecast, 2024 – 2034
9.2.4.5.3.Asia Pacific
9.2.4.5.3.1.Market Estimation, 2016 – 2023
9.2.4.5.3.2.Market Forecast, 2024 – 2034
9.2.4.5.4.Middle East and Africa
9.2.4.5.4.1.Market Estimation, 2016 – 2023
9.2.4.5.4.2.Market Forecast, 2024 – 2034
9.2.4.5.5.Latin America
9.2.4.5.5.1.Market Estimation, 2016 – 2023
9.2.4.5.5.2.Market Forecast, 2024 – 2034
9.3.Key Segment for Channeling Investments
9.3.1.By Technology
10.Global Synthetic Natural Gas Market Analysis and Forecasts, 2024 – 2034
10.1.Overview
10.2.Global Synthetic Natural Gas Market Revenue (US$ Mn) and Forecasts, By Application
10.2.1.Transportation
10.2.1.1.Definition
10.2.1.2.Market Estimation and Penetration, 2016 – 2023
10.2.1.3.Market Forecast, 2024 – 2034
10.2.1.4.Compound Annual Growth Rate (CAGR)
10.2.1.5.Regional Bifurcation
10.2.1.5.1.North America
10.2.1.5.1.1.Market Estimation, 2016 – 2023
10.2.1.5.1.2.Market Forecast, 2024 – 2034
10.2.1.5.2.Europe
10.2.1.5.2.1.Market Estimation, 2016 – 2023
10.2.1.5.2.2.Market Forecast, 2024 – 2034
10.2.1.5.3.Asia Pacific
10.2.1.5.3.1.Market Estimation, 2016 – 2023
10.2.1.5.3.2.Market Forecast, 2024 – 2034
10.2.1.5.4.Middle East and Africa
10.2.1.5.4.1.Market Estimation, 2016 – 2023
10.2.1.5.4.2.Market Forecast, 2024 – 2034
10.2.1.5.5.Latin America
10.2.1.5.5.1.Market Estimation, 2016 – 2023
10.2.1.5.5.2.Market Forecast, 2024 – 2034
10.2.2.Power Generation
10.2.2.1.Definition
10.2.2.2.Market Estimation and Penetration, 2016 – 2023
10.2.2.3.Market Forecast, 2024 – 2034
10.2.2.4.Compound Annual Growth Rate (CAGR)
10.2.2.5.Regional Bifurcation
10.2.2.5.1.North America
10.2.2.5.1.1.Market Estimation, 2016 – 2023
10.2.2.5.1.2.Market Forecast, 2024 – 2034
10.2.2.5.2.Europe
10.2.2.5.2.1.Market Estimation, 2016 – 2023
10.2.2.5.2.2.Market Forecast, 2024 – 2034
10.2.2.5.3.Asia Pacific
10.2.2.5.3.1.Market Estimation, 2016 – 2023
10.2.2.5.3.2.Market Forecast, 2024 – 2034
10.2.2.5.4.Middle East and Africa
10.2.2.5.4.1.Market Estimation, 2016 – 2023
10.2.2.5.4.2.Market Forecast, 2024 – 2034
10.2.2.5.5.Latin America
10.2.2.5.5.1.Market Estimation, 2016 – 2023
10.2.2.5.5.2.Market Forecast, 2024 – 2034
10.2.3.Industrial
10.2.3.1.Definition
10.2.3.2.Market Estimation and Penetration, 2016 – 2023
10.2.3.3.Market Forecast, 2024 – 2034
10.2.3.4.Compound Annual Growth Rate (CAGR)
10.2.3.5.Regional Bifurcation
10.2.3.5.1.North America
10.2.3.5.1.1.Market Estimation, 2016 – 2023
10.2.3.5.1.2.Market Forecast, 2024 – 2034
10.2.3.5.2.Europe
10.2.3.5.2.1.Market Estimation, 2016 – 2023
10.2.3.5.2.2.Market Forecast, 2024 – 2034
10.2.3.5.3.Asia Pacific
10.2.3.5.3.1.Market Estimation, 2016 – 2023
10.2.3.5.3.2.Market Forecast, 2024 – 2034
10.2.3.5.4.Middle East and Africa
10.2.3.5.4.1.Market Estimation, 2016 – 2023
10.2.3.5.4.2.Market Forecast, 2024 – 2034
10.2.3.5.5.Latin America
10.2.3.5.5.1.Market Estimation, 2016 – 2023
10.2.3.5.5.2.Market Forecast, 2024 – 2034
10.2.4.Grid Injection
10.2.4.1.Definition
10.2.4.2.Market Estimation and Penetration, 2016 – 2023
10.2.4.3.Market Forecast, 2024 – 2034
10.2.4.4.Compound Annual Growth Rate (CAGR)
10.2.4.5.Regional Bifurcation
10.2.4.5.1.North America
10.2.4.5.1.1.Market Estimation, 2016 – 2023
10.2.4.5.1.2.Market Forecast, 2024 – 2034
10.2.4.5.2.Europe
10.2.4.5.2.1.Market Estimation, 2016 – 2023
10.2.4.5.2.2.Market Forecast, 2024 – 2034
10.2.4.5.3.Asia Pacific
10.2.4.5.3.1.Market Estimation, 2016 – 2023
10.2.4.5.3.2.Market Forecast, 2024 – 2034
10.2.4.5.4.Middle East and Africa
10.2.4.5.4.1.Market Estimation, 2016 – 2023
10.2.4.5.4.2.Market Forecast, 2024 – 2034
10.2.4.5.5.Latin America
10.2.4.5.5.1.Market Estimation, 2016 – 2023
10.2.4.5.5.2.Market Forecast, 2024 – 2034
10.3.Key Segment for Channeling Investments
10.3.1.By Application
11.North America Synthetic Natural Gas Market Analysis and Forecasts, 2024 – 2034
11.1.Overview
11.1.1.North America Synthetic Natural Gas Market Revenue (US$ Mn)
11.2.North America Synthetic Natural Gas Market Revenue (US$ Mn) and Forecasts, By Source
11.2.1.Coal
11.2.2.Biomass
11.2.3.Renewable Energy
11.2.4.Others
11.3.North America Synthetic Natural Gas Market Revenue (US$ Mn) and Forecasts, By Technology
11.3.1.Anaerobic digestion and fermentation
11.3.2.Thermal gasification
11.3.2.1.Moving bed gasifier
11.3.2.2.Fluidized bed gasifier
11.3.2.3.Entrained flow gasifier
11.3.3.Power-to-gas
11.3.4.Others
11.4.North America Synthetic Natural Gas Market Revenue (US$ Mn) and Forecasts, By Application
11.4.1.Transportation
11.4.2.Power Generation
11.4.3.Industrial
11.4.4.Grid Injection
11.5.North America Synthetic Natural Gas Market Revenue (US$ Mn) and Forecasts, By Country
11.5.1.U.S
11.5.1.1.U.S Synthetic Natural Gas Market Revenue (US$ Mn) and Forecasts, By Source
11.5.1.1.1.Coal
11.5.1.1.2.Biomass
11.5.1.1.3.Renewable Energy
11.5.1.1.4.Others
11.5.1.2.U.S Synthetic Natural Gas Market Revenue (US$ Mn) and Forecasts, By Technology
11.5.1.2.1.Anaerobic digestion and fermentation
11.5.1.2.2.Thermal gasification
11.5.1.2.2.1.Moving bed gasifier
11.5.1.2.2.2.Fluidized bed gasifier
11.5.1.2.2.3.Entrained flow gasifier
11.5.1.2.3.Power-to-gas
11.5.1.2.4.Others
11.5.1.3.U.S Synthetic Natural Gas Market Revenue (US$ Mn) and Forecasts, By Application
11.5.1.3.1.Transportation
11.5.1.3.2.Power Generation
11.5.1.3.3.Industrial
11.5.1.3.4.Grid Injection
11.5.2.Canada
11.5.2.1.Canada Synthetic Natural Gas Market Revenue (US$ Mn) and Forecasts, By Source
11.5.2.1.1.Coal
11.5.2.1.2.Biomass
11.5.2.1.3.Renewable Energy
11.5.2.1.4.Others
11.5.2.2.Canada Synthetic Natural Gas Market Revenue (US$ Mn) and Forecasts, By Technology
11.5.2.2.1.Anaerobic digestion and fermentation
11.5.2.2.2.Thermal gasification
11.5.2.2.2.1.Moving bed gasifier
11.5.2.2.2.2.Fluidized bed gasifier
11.5.2.2.2.3.Entrained flow gasifier
11.5.2.2.3.Power-to-gas
11.5.2.2.4.Others
11.5.2.3.Canada Synthetic Natural Gas Market Revenue (US$ Mn) and Forecasts, By Application
11.5.2.3.1.Transportation
11.5.2.3.2.Power Generation
11.5.2.3.3.Industrial
11.5.2.3.4.Grid Injection
11.5.3.Mexico
11.5.3.1.Mexico Synthetic Natural Gas Market Revenue (US$ Mn) and Forecasts, By Source
11.5.3.1.1.Coal
11.5.3.1.2.Biomass
11.5.3.1.3.Renewable Energy
11.5.3.1.4.Others
11.5.3.2.Mexico Synthetic Natural Gas Market Revenue (US$ Mn) and Forecasts, By Technology
11.5.3.2.1.Anaerobic digestion and fermentation
11.5.3.2.2.Thermal gasification
11.5.3.2.2.1.Moving bed gasifier
11.5.3.2.2.2.Fluidized bed gasifier
11.5.3.2.2.3.Entrained flow gasifier
11.5.3.2.3.Power-to-gas
11.5.3.2.4.Others
11.5.3.3.Mexico Synthetic Natural Gas Market Revenue (US$ Mn) and Forecasts, By Application
11.5.3.3.1.Transportation
11.5.3.3.2.Power Generation
11.5.3.3.3.Industrial
11.5.3.3.4.Grid Injection
11.5.4.Rest of North America
11.5.4.1.Rest of North America Synthetic Natural Gas Market Revenue (US$ Mn) and Forecasts, By Source
11.5.4.1.1.Coal
11.5.4.1.2.Biomass
11.5.4.1.3.Renewable Energy
11.5.4.1.4.Others
11.5.4.2.Rest of North America Synthetic Natural Gas Market Revenue (US$ Mn) and Forecasts, By Technology
11.5.4.2.1.Anaerobic digestion and fermentation
11.5.4.2.2.Thermal gasification
11.5.4.2.2.1.Moving bed gasifier
11.5.4.2.2.2.Fluidized bed gasifier
11.5.4.2.2.3.Entrained flow gasifier
11.5.4.2.3.Power-to-gas
11.5.4.2.4.Others
11.5.4.3.Rest of North America Synthetic Natural Gas Market Revenue (US$ Mn) and Forecasts, By Application
11.5.4.3.1.Transportation
11.5.4.3.2.Power Generation
11.5.4.3.3.Industrial
11.5.4.3.4.Grid Injection
11.6.Key Segment for Channeling Investments
11.6.1.By Country
11.6.2.By Source
11.6.3.By Technology
11.6.4.By Application
12.Europe Synthetic Natural Gas Market Analysis and Forecasts, 2024 – 2034
12.1.Overview
12.1.1.Europe Synthetic Natural Gas Market Revenue (US$ Mn)
12.2.Europe Synthetic Natural Gas Market Revenue (US$ Mn) and Forecasts, By Source
12.2.1.Coal
12.2.2.Biomass
12.2.3.Renewable Energy
12.2.4.Others
12.3.Europe Synthetic Natural Gas Market Revenue (US$ Mn) and Forecasts, By Technology
12.3.1.Anaerobic digestion and fermentation
12.3.2.Thermal gasification
12.3.2.1.Moving bed gasifier
12.3.2.2.Fluidized bed gasifier
12.3.2.3.Entrained flow gasifier
12.3.3.Power-to-gas
12.3.4.Others
12.4.Europe Synthetic Natural Gas Market Revenue (US$ Mn) and Forecasts, By Application
12.4.1.Transportation
12.4.2.Power Generation
12.4.3.Industrial
12.4.4.Grid Injection
12.5.Europe Synthetic Natural Gas Market Revenue (US$ Mn) and Forecasts, By Country
12.5.1.France
12.5.1.1.France Synthetic Natural Gas Market Revenue (US$ Mn) and Forecasts, By Source
12.5.1.1.1.Coal
12.5.1.1.2.Biomass
12.5.1.1.3.Renewable Energy
12.5.1.1.4.Others
12.5.1.2.France Synthetic Natural Gas Market Revenue (US$ Mn) and Forecasts, By Technology
12.5.1.2.1.Anaerobic digestion and fermentation
12.5.1.2.2.Thermal gasification
12.5.1.2.2.1.Moving bed gasifier
12.5.1.2.2.2.Fluidized bed gasifier
12.5.1.2.2.3.Entrained flow gasifier
12.5.1.2.3.Power-to-gas
12.5.1.2.4.Others
12.5.1.3.France Synthetic Natural Gas Market Revenue (US$ Mn) and Forecasts, By Application
12.5.1.3.1.Transportation
12.5.1.3.2.Power Generation
12.5.1.3.3.Industrial
12.5.1.3.4.Grid Injection
12.5.2.The UK
12.5.2.1.The UK Synthetic Natural Gas Market Revenue (US$ Mn) and Forecasts, By Source
12.5.2.1.1.Coal
12.5.2.1.2.Biomass
12.5.2.1.3.Renewable Energy
12.5.2.1.4.Others
12.5.2.2.The UK Synthetic Natural Gas Market Revenue (US$ Mn) and Forecasts, By Technology
12.5.2.2.1.Anaerobic digestion and fermentation
12.5.2.2.2.Thermal gasification
12.5.2.2.2.1.Moving bed gasifier
12.5.2.2.2.2.Fluidized bed gasifier
12.5.2.2.2.3.Entrained flow gasifier
12.5.2.2.3.Power-to-gas
12.5.2.2.4.Others
12.5.2.3.The UK Synthetic Natural Gas Market Revenue (US$ Mn) and Forecasts, By Application
12.5.2.3.1.Transportation
12.5.2.3.2.Power Generation
12.5.2.3.3.Industrial
12.5.2.3.4.Grid Injection
12.5.3.Spain
12.5.3.1.Spain Synthetic Natural Gas Market Revenue (US$ Mn) and Forecasts, By Source
12.5.3.1.1.Coal
12.5.3.1.2.Biomass
12.5.3.1.3.Renewable Energy
12.5.3.1.4.Others
12.5.3.2.Spain Synthetic Natural Gas Market Revenue (US$ Mn) and Forecasts, By Technology
12.5.3.2.1.Anaerobic digestion and fermentation
12.5.3.2.2.Thermal gasification
12.5.3.2.2.1.Moving bed gasifier
12.5.3.2.2.2.Fluidized bed gasifier
12.5.3.2.2.3.Entrained flow gasifier
12.5.3.2.3.Power-to-gas
12.5.3.2.4.Others
12.5.3.3.Spain Synthetic Natural Gas Market Revenue (US$ Mn) and Forecasts, By Application
12.5.3.3.1.Transportation
12.5.3.3.2.Power Generation
12.5.3.3.3.Industrial
12.5.3.3.4.Grid Injection
12.5.4.Germany
12.5.4.1.Germany Synthetic Natural Gas Market Revenue (US$ Mn) and Forecasts, By Source
12.5.4.1.1.Coal
12.5.4.1.2.Biomass
12.5.4.1.3.Renewable Energy
12.5.4.1.4.Others
12.5.4.2.Germany Synthetic Natural Gas Market Revenue (US$ Mn) and Forecasts, By Technology
12.5.4.2.1.Anaerobic digestion and fermentation
12.5.4.2.2.Thermal gasification
12.5.4.2.2.1.Moving bed gasifier
12.5.4.2.2.2.Fluidized bed gasifier
12.5.4.2.2.3.Entrained flow gasifier
12.5.4.2.3.Power-to-gas
12.5.4.2.4.Others
12.5.4.3.Germany Synthetic Natural Gas Market Revenue (US$ Mn) and Forecasts, By Application
12.5.4.3.1.Transportation
12.5.4.3.2.Power Generation
12.5.4.3.3.Industrial
12.5.4.3.4.Grid Injection
12.5.5.Italy
12.5.5.1.Italy Synthetic Natural Gas Market Revenue (US$ Mn) and Forecasts, By Source
12.5.5.1.1.Coal
12.5.5.1.2.Biomass
12.5.5.1.3.Renewable Energy
12.5.5.1.4.Others
12.5.5.2.Italy Synthetic Natural Gas Market Revenue (US$ Mn) and Forecasts, By Technology
12.5.5.2.1.Anaerobic digestion and fermentation
12.5.5.2.2.Thermal gasification
12.5.5.2.2.1.Moving bed gasifier
12.5.5.2.2.2.Fluidized bed gasifier
12.5.5.2.2.3.Entrained flow gasifier
12.5.5.2.3.Power-to-gas
12.5.5.2.4.Others
12.5.5.3.Italy Synthetic Natural Gas Market Revenue (US$ Mn) and Forecasts, By Application
12.5.5.3.1.Transportation
12.5.5.3.2.Power Generation
12.5.5.3.3.Industrial
12.5.5.3.4.Grid Injection
12.5.6.Nordic Countries
12.5.6.1.Nordic Countries Synthetic Natural Gas Market Revenue (US$ Mn) and Forecasts, By Source
12.5.6.1.1.Coal
12.5.6.1.2.Biomass
12.5.6.1.3.Renewable Energy
12.5.6.1.4.Others
12.5.6.2.Nordic Countries Synthetic Natural Gas Market Revenue (US$ Mn) and Forecasts, By Technology
12.5.6.2.1.Anaerobic digestion and fermentation
12.5.6.2.2.Thermal gasification
12.5.6.2.2.1.Moving bed gasifier
12.5.6.2.2.2.Fluidized bed gasifier
12.5.6.2.2.3.Entrained flow gasifier
12.5.6.2.3.Power-to-gas
12.5.6.2.4.Others
12.5.6.3.Nordic Countries Synthetic Natural Gas Market Revenue (US$ Mn) and Forecasts, By Application
12.5.6.3.1.Transportation
12.5.6.3.2.Power Generation
12.5.6.3.3.Industrial
12.5.6.3.4.Grid Injection
12.5.6.4.Nordic Countries Synthetic Natural Gas Market Revenue (US$ Mn) and Forecasts, By Country
12.5.6.4.1.Denmark
12.5.6.4.2.Finland
12.5.6.4.3.Iceland
12.5.6.4.4.Sweden
12.5.6.4.5.Norway
12.5.7.Benelux Union
12.5.7.1.Benelux Union Synthetic Natural Gas Market Revenue (US$ Mn) and Forecasts, By Source
12.5.7.1.1.Coal
12.5.7.1.2.Biomass
12.5.7.1.3.Renewable Energy
12.5.7.1.4.Others
12.5.7.2.Benelux Union Synthetic Natural Gas Market Revenue (US$ Mn) and Forecasts, By Technology
12.5.7.2.1.Anaerobic digestion and fermentation
12.5.7.2.2.Thermal gasification
12.5.7.2.2.1.Moving bed gasifier
12.5.7.2.2.2.Fluidized bed gasifier
12.5.7.2.2.3.Entrained flow gasifier
12.5.7.2.3.Power-to-gas
12.5.7.2.4.Others
12.5.7.3.Benelux Union Synthetic Natural Gas Market Revenue (US$ Mn) and Forecasts, By Application
12.5.7.3.1.Transportation
12.5.7.3.2.Power Generation
12.5.7.3.3.Industrial
12.5.7.3.4.Grid Injection
12.5.7.4.Benelux Union Synthetic Natural Gas Market Revenue (US$ Mn) and Forecasts, By Country
12.5.7.4.1.Belgium
12.5.7.4.2.The Netherlands
12.5.7.4.3.Luxembourg
12.5.8.Rest of Europe
12.5.8.1.Rest of Europe Synthetic Natural Gas Market Revenue (US$ Mn) and Forecasts, By Source
12.5.8.1.1.Coal
12.5.8.1.2.Biomass
12.5.8.1.3.Renewable Energy
12.5.8.1.4.Others
12.5.8.2.Rest of Europe Synthetic Natural Gas Market Revenue (US$ Mn) and Forecasts, By Technology
12.5.8.2.1.Anaerobic digestion and fermentation
12.5.8.2.2.Thermal gasification
12.5.8.2.2.1.Moving bed gasifier
12.5.8.2.2.2.Fluidized bed gasifier
12.5.8.2.2.3.Entrained flow gasifier
12.5.8.2.3.Power-to-gas
12.5.8.2.4.Others
12.5.8.3.Rest of Europe Synthetic Natural Gas Market Revenue (US$ Mn) and Forecasts, By Application
12.5.8.3.1.Transportation
12.5.8.3.2.Power Generation
12.5.8.3.3.Industrial
12.5.8.3.4.Grid Injection
12.6.Key Segment for Channeling Investments
12.6.1.By Country
12.6.2.By Source
12.6.3.By Technology
12.6.4.By Application
13.Asia Pacific Synthetic Natural Gas Market Analysis and Forecasts, 2024 – 2034
13.1.Overview
13.1.1.Asia Pacific Synthetic Natural Gas Market Revenue (US$ Mn)
13.2.Asia Pacific Synthetic Natural Gas Market Revenue (US$ Mn) and Forecasts, By Source
13.2.1.Coal
13.2.2.Biomass
13.2.3.Renewable Energy
13.2.4.Others
13.3.Asia Pacific Synthetic Natural Gas Market Revenue (US$ Mn) and Forecasts, By Technology
13.3.1.Anaerobic digestion and fermentation
13.3.2.Thermal gasification
13.3.2.1.Moving bed gasifier
13.3.2.2.Fluidized bed gasifier
13.3.2.3.Entrained flow gasifier
13.3.3.Power-to-gas
13.3.4.Others
13.4.Asia Pacific Synthetic Natural Gas Market Revenue (US$ Mn) and Forecasts, By Application
13.4.1.Transportation
13.4.2.Power Generation
13.4.3.Industrial
13.4.4.Grid Injection
13.5.Asia Pacific Synthetic Natural Gas Market Revenue (US$ Mn) and Forecasts, By Country
13.5.1.China
13.5.1.1.China Synthetic Natural Gas Market Revenue (US$ Mn) and Forecasts, By Source
13.5.1.1.1.Coal
13.5.1.1.2.Biomass
13.5.1.1.3.Renewable Energy
13.5.1.1.4.Others
13.5.1.2.China Synthetic Natural Gas Market Revenue (US$ Mn) and Forecasts, By Technology
13.5.1.2.1.Anaerobic digestion and fermentation
13.5.1.2.2.Thermal gasification
13.5.1.2.2.1.Moving bed gasifier
13.5.1.2.2.2.Fluidized bed gasifier
13.5.1.2.2.3.Entrained flow gasifier
13.5.1.2.3.Power-to-gas
13.5.1.2.4.Others
13.5.1.3.China Synthetic Natural Gas Market Revenue (US$ Mn) and Forecasts, By Application
13.5.1.3.1.Transportation
13.5.1.3.2.Power Generation
13.5.1.3.3.Industrial
13.5.1.3.4.Grid Injection
13.5.2.Japan
13.5.2.1.Japan Synthetic Natural Gas Market Revenue (US$ Mn) and Forecasts, By Source
13.5.2.1.1.Coal
13.5.2.1.2.Biomass
13.5.2.1.3.Renewable Energy
13.5.2.1.4.Others
13.5.2.2.Japan Synthetic Natural Gas Market Revenue (US$ Mn) and Forecasts, By Technology
13.5.2.2.1.Anaerobic digestion and fermentation
13.5.2.2.2.Thermal gasification
13.5.2.2.2.1.Moving bed gasifier
13.5.2.2.2.2.Fluidized bed gasifier
13.5.2.2.2.3.Entrained flow gasifier
13.5.2.2.3.Power-to-gas
13.5.2.2.4.Others
13.5.2.3.Japan Synthetic Natural Gas Market Revenue (US$ Mn) and Forecasts, By Application
13.5.2.3.1.Transportation
13.5.2.3.2.Power Generation
13.5.2.3.3.Industrial
13.5.2.3.4.Grid Injection
13.5.3.India
13.5.3.1.India Synthetic Natural Gas Market Revenue (US$ Mn) and Forecasts, By Source
13.5.3.1.1.Coal
13.5.3.1.2.Biomass
13.5.3.1.3.Renewable Energy
13.5.3.1.4.Others
13.5.3.2.India Synthetic Natural Gas Market Revenue (US$ Mn) and Forecasts, By Technology
13.5.3.2.1.Anaerobic digestion and fermentation
13.5.3.2.2.Thermal gasification
13.5.3.2.2.1.Moving bed gasifier
13.5.3.2.2.2.Fluidized bed gasifier
13.5.3.2.2.3.Entrained flow gasifier
13.5.3.2.3.Power-to-gas
13.5.3.2.4.Others
13.5.3.3.India Synthetic Natural Gas Market Revenue (US$ Mn) and Forecasts, By Application
13.5.3.3.1.Transportation
13.5.3.3.2.Power Generation
13.5.3.3.3.Industrial
13.5.3.3.4.Grid Injection
13.5.4.New Zealand
13.5.4.1.New Zealand Synthetic Natural Gas Market Revenue (US$ Mn) and Forecasts, By Source
13.5.4.1.1.Coal
13.5.4.1.2.Biomass
13.5.4.1.3.Renewable Energy
13.5.4.1.4.Others
13.5.4.2.New Zealand Synthetic Natural Gas Market Revenue (US$ Mn) and Forecasts, By Technology
13.5.4.2.1.Anaerobic digestion and fermentation
13.5.4.2.2.Thermal gasification
13.5.4.2.2.1.Moving bed gasifier
13.5.4.2.2.2.Fluidized bed gasifier
13.5.4.2.2.3.Entrained flow gasifier
13.5.4.2.3.Power-to-gas
13.5.4.2.4.Others
13.5.4.3.New Zealand Synthetic Natural Gas Market Revenue (US$ Mn) and Forecasts, By Application
13.5.4.3.1.Transportation
13.5.4.3.2.Power Generation
13.5.4.3.3.Industrial
13.5.4.3.4.Grid Injection
13.5.5.Australia
13.5.5.1.Australia Synthetic Natural Gas Market Revenue (US$ Mn) and Forecasts, By Source
13.5.5.1.1.Coal
13.5.5.1.2.Biomass
13.5.5.1.3.Renewable Energy
13.5.5.1.4.Others
13.5.5.2.Australia Synthetic Natural Gas Market Revenue (US$ Mn) and Forecasts, By Technology
13.5.5.2.1.Anaerobic digestion and fermentation
13.5.5.2.2.Thermal gasification
13.5.5.2.2.1.Moving bed gasifier
13.5.5.2.2.2.Fluidized bed gasifier
13.5.5.2.2.3.Entrained flow gasifier
13.5.5.2.3.Power-to-gas
13.5.5.2.4.Others
13.5.5.3.Australia Synthetic Natural Gas Market Revenue (US$ Mn) and Forecasts, By Application
13.5.5.3.1.Transportation
13.5.5.3.2.Power Generation
13.5.5.3.3.Industrial
13.5.5.3.4.Grid Injection
13.5.6.South Korea
13.5.6.1.South Korea Synthetic Natural Gas Market Revenue (US$ Mn) and Forecasts, By Source
13.5.6.1.1.Coal
13.5.6.1.2.Biomass
13.5.6.1.3.Renewable Energy
13.5.6.1.4.Others
13.5.6.2.South Korea Synthetic Natural Gas Market Revenue (US$ Mn) and Forecasts, By Technology
13.5.6.2.1.Anaerobic digestion and fermentation
13.5.6.2.2.Thermal gasification
13.5.6.2.2.1.Moving bed gasifier
13.5.6.2.2.2.Fluidized bed gasifier
13.5.6.2.2.3.Entrained flow gasifier
13.5.6.2.3.Power-to-gas
13.5.6.2.4.Others
13.5.6.3.South Korea Synthetic Natural Gas Market Revenue (US$ Mn) and Forecasts, By Application
13.5.6.3.1.Transportation
13.5.6.3.2.Power Generation
13.5.6.3.3.Industrial
13.5.6.3.4.Grid Injection
13.5.7.Southeast Asia
13.5.7.1.Southeast Asia Synthetic Natural Gas Market Revenue (US$ Mn) and Forecasts, By Source
13.5.7.1.1.Coal
13.5.7.1.2.Biomass
13.5.7.1.3.Renewable Energy
13.5.7.1.4.Others
13.5.7.2.Southeast Asia Synthetic Natural Gas Market Revenue (US$ Mn) and Forecasts, By Technology
13.5.7.2.1.Anaerobic digestion and fermentation
13.5.7.2.2.Thermal gasification
13.5.7.2.2.1.Moving bed gasifier
13.5.7.2.2.2.Fluidized bed gasifier
13.5.7.2.2.3.Entrained flow gasifier
13.5.7.2.3.Power-to-gas
13.5.7.2.4.Others
13.5.7.3.Southeast Asia Synthetic Natural Gas Market Revenue (US$ Mn) and Forecasts, By Application
13.5.7.3.1.Transportation
13.5.7.3.2.Power Generation
13.5.7.3.3.Industrial
13.5.7.3.4.Grid Injection
13.5.7.4.Southeast Asia Synthetic Natural Gas Market Revenue (US$ Mn) and Forecasts, By Country
13.5.7.4.1.Indonesia
13.5.7.4.2.Thailand
13.5.7.4.3.Malaysia
13.5.7.4.4.Singapore
13.5.7.4.5.Rest of Southeast Asia
13.5.8.Rest of Asia Pacific
13.5.8.1.Rest of Asia Pacific Synthetic Natural Gas Market Revenue (US$ Mn) and Forecasts, By Source
13.5.8.1.1.Coal
13.5.8.1.2.Biomass
13.5.8.1.3.Renewable Energy
13.5.8.1.4.Others
13.5.8.2.Rest of Asia Pacific Synthetic Natural Gas Market Revenue (US$ Mn) and Forecasts, By Technology
13.5.8.2.1.Anaerobic digestion and fermentation
13.5.8.2.2.Thermal gasification
13.5.8.2.2.1.Moving bed gasifier
13.5.8.2.2.2.Fluidized bed gasifier
13.5.8.2.2.3.Entrained flow gasifier
13.5.8.2.3.Power-to-gas
13.5.8.2.4.Others
13.5.8.3.Rest of Asia Pacific Synthetic Natural Gas Market Revenue (US$ Mn) and Forecasts, By Application
13.5.8.3.1.Transportation
13.5.8.3.2.Power Generation
13.5.8.3.3.Industrial
13.5.8.3.4.Grid Injection
13.6.Key Segment for Channeling Investments
13.6.1.By Country
13.6.2.By Source
13.6.3.By Technology
13.6.4.By Application
14.Middle East and Africa Synthetic Natural Gas Market Analysis and Forecasts, 2024 – 2034
14.1.Overview
14.1.1.Middle East and Africa Synthetic Natural Gas Market Revenue (US$ Mn)
14.2.Middle East and Africa Synthetic Natural Gas Market Revenue (US$ Mn) and Forecasts, By Source
14.2.1.Coal
14.2.2.Biomass
14.2.3.Renewable Energy
14.2.4.Others
14.3.Middle East and Africa Synthetic Natural Gas Market Revenue (US$ Mn) and Forecasts, By Technology
14.3.1.Anaerobic digestion and fermentation
14.3.2.Thermal gasification
14.3.2.1.Moving bed gasifier
14.3.2.2.Fluidized bed gasifier
14.3.2.3.Entrained flow gasifier
14.3.3.Power-to-gas
14.3.4.Others
14.4.Middle East and Africa Synthetic Natural Gas Market Revenue (US$ Mn) and Forecasts, By Application
14.4.1.Transportation
14.4.2.Power Generation
14.4.3.Industrial
14.4.4.Grid Injection
14.5.Middle East and Africa Synthetic Natural Gas Market Revenue (US$ Mn) and Forecasts, By Country
14.5.1.Saudi Arabia
14.5.1.1.Saudi Arabia Synthetic Natural Gas Market Revenue (US$ Mn) and Forecasts, By Source
14.5.1.1.1.Coal
14.5.1.1.2.Biomass
14.5.1.1.3.Renewable Energy
14.5.1.1.4.Others
14.5.1.2.Saudi Arabia Synthetic Natural Gas Market Revenue (US$ Mn) and Forecasts, By Technology
14.5.1.2.1.Anaerobic digestion and fermentation
14.5.1.2.2.Thermal gasification
14.5.1.2.2.1.Moving bed gasifier
14.5.1.2.2.2.Fluidized bed gasifier
14.5.1.2.2.3.Entrained flow gasifier
14.5.1.2.3.Power-to-gas
14.5.1.2.4.Others
14.5.1.3.Saudi Arabia Synthetic Natural Gas Market Revenue (US$ Mn) and Forecasts, By Application
14.5.1.3.1.Transportation
14.5.1.3.2.Power Generation
14.5.1.3.3.Industrial
14.5.1.3.4.Grid Injection
14.5.2.UAE
14.5.2.1.UAE Synthetic Natural Gas Market Revenue (US$ Mn) and Forecasts, By Source
14.5.2.1.1.Coal
14.5.2.1.2.Biomass
14.5.2.1.3.Renewable Energy
14.5.2.1.4.Others
14.5.2.2.UAE Synthetic Natural Gas Market Revenue (US$ Mn) and Forecasts, By Technology
14.5.2.2.1.Anaerobic digestion and fermentation
14.5.2.2.2.Thermal gasification
14.5.2.2.2.1.Moving bed gasifier
14.5.2.2.2.2.Fluidized bed gasifier
14.5.2.2.2.3.Entrained flow gasifier
14.5.2.2.3.Power-to-gas
14.5.2.2.4.Others
14.5.2.3.UAE Synthetic Natural Gas Market Revenue (US$ Mn) and Forecasts, By Application
14.5.2.3.1.Transportation
14.5.2.3.2.Power Generation
14.5.2.3.3.Industrial
14.5.2.3.4.Grid Injection
14.5.3.Egypt
14.5.3.1.Egypt Synthetic Natural Gas Market Revenue (US$ Mn) and Forecasts, By Source
14.5.3.1.1.Coal
14.5.3.1.2.Biomass
14.5.3.1.3.Renewable Energy
14.5.3.1.4.Others
14.5.3.2.Egypt Synthetic Natural Gas Market Revenue (US$ Mn) and Forecasts, By Technology
14.5.3.2.1.Anaerobic digestion and fermentation
14.5.3.2.2.Thermal gasification
14.5.3.2.2.1.Moving bed gasifier
14.5.3.2.2.2.Fluidized bed gasifier
14.5.3.2.2.3.Entrained flow gasifier
14.5.3.2.3.Power-to-gas
14.5.3.2.4.Others
14.5.3.3.Egypt Synthetic Natural Gas Market Revenue (US$ Mn) and Forecasts, By Application
14.5.3.3.1.Transportation
14.5.3.3.2.Power Generation
14.5.3.3.3.Industrial
14.5.3.3.4.Grid Injection
14.5.4.Kuwait
14.5.4.1.Kuwait Synthetic Natural Gas Market Revenue (US$ Mn) and Forecasts, By Source
14.5.4.1.1.Coal
14.5.4.1.2.Biomass
14.5.4.1.3.Renewable Energy
14.5.4.1.4.Others
14.5.4.2.Kuwait Synthetic Natural Gas Market Revenue (US$ Mn) and Forecasts, By Technology
14.5.4.2.1.Anaerobic digestion and fermentation
14.5.4.2.2.Thermal gasification
14.5.4.2.2.1.Moving bed gasifier
14.5.4.2.2.2.Fluidized bed gasifier
14.5.4.2.2.3.Entrained flow gasifier
14.5.4.2.3.Power-to-gas
14.5.4.2.4.Others
14.5.4.3.Kuwait Synthetic Natural Gas Market Revenue (US$ Mn) and Forecasts, By Application
14.5.4.3.1.Transportation
14.5.4.3.2.Power Generation
14.5.4.3.3.Industrial
14.5.4.3.4.Grid Injection
14.5.5.South Africa
14.5.5.1.South Africa Synthetic Natural Gas Market Revenue (US$ Mn) and Forecasts, By Source
14.5.5.1.1.Coal
14.5.5.1.2.Biomass
14.5.5.1.3.Renewable Energy
14.5.5.1.4.Others
14.5.5.2.South Africa Synthetic Natural Gas Market Revenue (US$ Mn) and Forecasts, By Technology
14.5.5.2.1.Anaerobic digestion and fermentation
14.5.5.2.2.Thermal gasification
14.5.5.2.2.1.Moving bed gasifier
14.5.5.2.2.2.Fluidized bed gasifier
14.5.5.2.2.3.Entrained flow gasifier
14.5.5.2.3.Power-to-gas
14.5.5.2.4.Others
14.5.5.3.South Africa Synthetic Natural Gas Market Revenue (US$ Mn) and Forecasts, By Application
14.5.5.3.1.Transportation
14.5.5.3.2.Power Generation
14.5.5.3.3.Industrial
14.5.5.3.4.Grid Injection
14.5.6.Rest of Middle East & Africa
14.5.6.1.Rest of Middle East & Africa Synthetic Natural Gas Market Revenue (US$ Mn) and Forecasts, By Source
14.5.6.1.1.Coal
14.5.6.1.2.Biomass
14.5.6.1.3.Renewable Energy
14.5.6.1.4.Others
14.5.6.2.Rest of Middle East & Africa Synthetic Natural Gas Market Revenue (US$ Mn) and Forecasts, By Technology
14.5.6.2.1.Anaerobic digestion and fermentation
14.5.6.2.2.Thermal gasification
14.5.6.2.2.1.Moving bed gasifier
14.5.6.2.2.2.Fluidized bed gasifier
14.5.6.2.2.3.Entrained flow gasifier
14.5.6.2.3.Power-to-gas
14.5.6.2.4.Others
14.5.6.3.Rest of Middle East & Africa Synthetic Natural Gas Market Revenue (US$ Mn) and Forecasts, By Application
14.5.6.3.1.Transportation
14.5.6.3.2.Power Generation
14.5.6.3.3.Industrial
14.5.6.3.4.Grid Injection
14.6.Key Segment for Channeling Investments
14.6.1.By Country
14.6.2.By Source
14.6.3.By Technology
14.6.4.By Application
15.Latin America Synthetic Natural Gas Market Analysis and Forecasts, 2024 – 2034
15.1.Overview
15.1.1.Latin America Synthetic Natural Gas Market Revenue (US$ Mn)
15.2.Latin America Synthetic Natural Gas Market Revenue (US$ Mn) and Forecasts, By Source
15.2.1.Coal
15.2.2.Biomass
15.2.3.Renewable Energy
15.2.4.Others
15.3.Latin America Synthetic Natural Gas Market Revenue (US$ Mn) and Forecasts, By Technology
15.3.1.Anaerobic digestion and fermentation
15.3.2.Thermal gasification
15.3.2.1.Moving bed gasifier
15.3.2.2.Fluidized bed gasifier
15.3.2.3.Entrained flow gasifier
15.3.3.Power-to-gas
15.3.4.Others
15.4.Latin America Synthetic Natural Gas Market Revenue (US$ Mn) and Forecasts, By Application
15.4.1.Transportation
15.4.2.Power Generation
15.4.3.Industrial
15.4.4.Grid Injection
15.5.Latin America Synthetic Natural Gas Market Revenue (US$ Mn) and Forecasts, By Country
15.5.1.Brazil
15.5.1.1.Brazil Synthetic Natural Gas Market Revenue (US$ Mn) and Forecasts, By Source
15.5.1.1.1.Coal
15.5.1.1.2.Biomass
15.5.1.1.3.Renewable Energy
15.5.1.1.4.Others
15.5.1.2.Brazil Synthetic Natural Gas Market Revenue (US$ Mn) and Forecasts, By Technology
15.5.1.2.1.Anaerobic digestion and fermentation
15.5.1.2.2.Thermal gasification
15.5.1.2.2.1.Moving bed gasifier
15.5.1.2.2.2.Fluidized bed gasifier
15.5.1.2.2.3.Entrained flow gasifier
15.5.1.2.3.Power-to-gas
15.5.1.2.4.Others
15.5.1.3.Brazil Synthetic Natural Gas Market Revenue (US$ Mn) and Forecasts, By Application
15.5.1.3.1.Transportation
15.5.1.3.2.Power Generation
15.5.1.3.3.Industrial
15.5.1.3.4.Grid Injection
15.5.2.Argentina
15.5.2.1.Argentina Synthetic Natural Gas Market Revenue (US$ Mn) and Forecasts, By Source
15.5.2.1.1.Coal
15.5.2.1.2.Biomass
15.5.2.1.3.Renewable Energy
15.5.2.1.4.Others
15.5.2.2.Argentina Synthetic Natural Gas Market Revenue (US$ Mn) and Forecasts, By Technology
15.5.2.2.1.Anaerobic digestion and fermentation
15.5.2.2.2.Thermal gasification
15.5.2.2.2.1.Moving bed gasifier
15.5.2.2.2.2.Fluidized bed gasifier
15.5.2.2.2.3.Entrained flow gasifier
15.5.2.2.3.Power-to-gas
15.5.2.2.4.Others
15.5.2.3.Argentina Synthetic Natural Gas Market Revenue (US$ Mn) and Forecasts, By Application
15.5.2.3.1.Transportation
15.5.2.3.2.Power Generation
15.5.2.3.3.Industrial
15.5.2.3.4.Grid Injection
15.5.3.Rest of Latin America
15.5.3.1.Rest of Latin America Synthetic Natural Gas Market Revenue (US$ Mn) and Forecasts, By Source
15.5.3.1.1.Coal
15.5.3.1.2.Biomass
15.5.3.1.3.Renewable Energy
15.5.3.1.4.Others
15.5.3.2.Rest of Latin America Synthetic Natural Gas Market Revenue (US$ Mn) and Forecasts, By Technology
15.5.3.2.1.Anaerobic digestion and fermentation
15.5.3.2.2.Thermal gasification
15.5.3.2.2.1.Moving bed gasifier
15.5.3.2.2.2.Fluidized bed gasifier
15.5.3.2.2.3.Entrained flow gasifier
15.5.3.2.3.Power-to-gas
15.5.3.2.4.Others
15.5.3.3.Rest of Latin America Synthetic Natural Gas Market Revenue (US$ Mn) and Forecasts, By Application
15.5.3.3.1.Transportation
15.5.3.3.2.Power Generation
15.5.3.3.3.Industrial
15.5.3.3.4.Grid Injection
15.6.Key Segment for Channeling Investments
15.6.1.By Country
15.6.2.By Source
15.6.3.By Technology
15.6.4.By Application
16.Competitive Benchmarking
16.1.Brand Benchmarking
16.2.Market Share Analysis, 2023
16.3.Global Presence and Growth Strategies
16.3.1.Mergers and Acquisitions
16.3.2.Product Launches
16.3.3.Investments Trends
16.3.4.R&D Initiatives
17.Player Profiles
17.1.Air Liquide
17.1.1.Company Details
17.1.2.Company Overview
17.1.3.Product Offerings
17.1.4.Key Developments
17.1.5.Financial Analysis
17.1.6.SWOT Analysis
17.1.7.Business Strategies
17.2.Basin Electric Power Cooperative
17.2.1.Company Details
17.2.2.Company Overview
17.2.3.Product Offerings
17.2.4.Key Developments
17.2.5.Financial Analysis
17.2.6.SWOT Analysis
17.2.7.Business Strategies
17.3.Chevron Corporation
17.3.1.Company Details
17.3.2.Company Overview
17.3.3.Product Offerings
17.3.4.Key Developments
17.3.5.Financial Analysis
17.3.6.SWOT Analysis
17.3.7.Business Strategies
17.4.E. ON SE
17.4.1.Company Details
17.4.2.Company Overview
17.4.3.Product Offerings
17.4.4.Key Developments
17.4.5.Financial Analysis
17.4.6.SWOT Analysis
17.4.7.Business Strategies
17.5.EnviTec Biogas AG
17.5.1.Company Details
17.5.2.Company Overview
17.5.3.Product Offerings
17.5.4.Key Developments
17.5.5.Financial Analysis
17.5.6.SWOT Analysis
17.5.7.Business Strategies
17.6.Kinder Morgan
17.6.1.Company Details
17.6.2.Company Overview
17.6.3.Product Offerings
17.6.4.Key Developments
17.6.5.Financial Analysis
17.6.6.SWOT Analysis
17.6.7.Business Strategies
17.7.MAN Energy Solutions
17.7.1.Company Details
17.7.2.Company Overview
17.7.3.Product Offerings
17.7.4.Key Developments
17.7.5.Financial Analysis
17.7.6.SWOT Analysis
17.7.7.Business Strategies
17.8.OPAL Fuels
17.8.1.Company Details
17.8.2.Company Overview
17.8.3.Product Offerings
17.8.4.Key Developments
17.8.5.Financial Analysis
17.8.6.SWOT Analysis
17.8.7.Business Strategies
17.9.Total Energies
17.9.1.Company Details
17.9.2.Company Overview
17.9.3.Product Offerings
17.9.4.Key Developments
17.9.5.Financial Analysis
17.9.6.SWOT Analysis
17.9.7.Business Strategies
17.10.Verbio SE
17.10.1.Company Details
17.10.2.Company Overview
17.10.3.Product Offerings
17.10.4.Key Developments
17.10.5.Financial Analysis
17.10.6.SWOT Analysis
17.10.7.Business Strategies
17.11.Waga Energy
17.11.1.Company Details
17.11.2.Company Overview
17.11.3.Product Offerings
17.11.4.Key Developments
17.11.5.Financial Analysis
17.11.6.SWOT Analysis
17.11.7.Business Strategies
17.12.Other Market Participants
18.Key Findings

.

**Exclusive for Multi-User and Enterprise User.

Global Synthetic Natural Gas Market

By Source

  • Coal
  • Biomass
  • Renewable Energy
  • Others

By Technology

  • Anaerobic digestion & fermentation
  • Thermal gasification
    • Moving bed gasifier
    • Fluidized bed gasifier
    • Entrained flow gasifier
  • Power-to-gas
  • Others

By Application

  • Transportation
  • Power Generation
  • Industrial
  • Grid Injection

By Region

  • North America (U.S., Canada, Mexico, Rest of North America)
  • Europe (France, The UK, Spain, Germany, Italy, Nordic Countries (Denmark, Finland, Iceland, Sweden, Norway), Benelux Union (Belgium, The Netherlands, Luxembourg), Rest of Europe)
  • Asia Pacific (China, Japan, India, New Zealand, Australia, South Korea, Southeast Asia (Indonesia, Thailand, Malaysia, Singapore, Rest of Southeast Asia), Rest of Asia Pacific)
  • Middle East & Africa (Saudi Arabia, UAE, Egypt, Kuwait, South Africa, Rest of Middle East & Africa)
  • Latin America (Brazil, Argentina, Rest of Latin America)

The Niche Research approach encompasses both primary and secondary research methods to provide comprehensive insights. While primary research is the cornerstone of our studies, we also incorporate secondary research sources such as company annual reports, premium industry databases, press releases, industry journals, and white papers.

Within our primary research, we actively engage with various industry stakeholders, conducting paid interviews and surveys. Our meticulous analysis extends to every market participant in major countries, allowing us to thoroughly examine their portfolios, calculate market shares, and segment revenues.

Our data collection primarily focuses on individual countries within our research scope, enabling us to estimate regional market sizes. Typically, we employ a bottom-up approach, meticulously tracking trends in different countries. We analyze growth drivers, constraints, technological innovations, and opportunities for each country, ultimately arriving at regional figures.Our process begins by examining the growth prospects of each country. Building upon these insights, we project growth and trends for the entire region. Finally, we utilize our proprietary model to refine estimations and forecasts.

Our data validation standards are integral to ensuring the reliability and accuracy of our research findings. Here’s a breakdown of our data validation processes and the stakeholders we engage with during our primary research:

  • Supply Side Analysis: We initiate a supply side analysis by directly contacting market participants, through telephonic interviews and questionnaires containing both open-ended and close-ended questions. We gather information on their portfolios, segment revenues, developments, and growth strategies.
  • Demand Side Analysis: To gain insights into adoption trends and consumer preferences, we reach out to target customers and users (non-vendors). This information forms a vital part of the qualitative analysis section of our reports, covering market dynamics, adoption trends, consumer behavior, spending patterns, and other related aspects.
  • Consultant Insights: We tap into the expertise of our partner consultants from around the world to obtain their unique viewpoints and perspectives. Their insights contribute to a well-rounded understanding of the markets under investigation.
  • In-House Validation: To ensure data accuracy and reliability, we conduct cross-validation of data points and information through our in-house team of consultants and utilize advanced data modeling tools for thorough verification.

The forecasts we provide are based on a comprehensive assessment of various factors, including:

  • Market Trends and Past Performance (Last Five Years): We accurately analyze market trends and performance data from preceding five years to identify historical patterns and understand the market’s evolution.
  • Historical Performance and Growth of Market Participants: We assess the historical performance and growth trajectories of key market participants. This analysis provides insights into the competitive landscape and individual company strategies.
  • Market Determinants Impact Analysis (Next Eight Years): We conduct a rigorous analysis of the factors that are projected to influence the market over the next eight years. This includes assessing both internal and external determinants that can shape market dynamics.
  • Drivers and Challenges for the Forecast Period:Identify the factors expected to drive market growth during the forecast period, as well as the challenges that the industry may face. This analysis aids in deriving an accurate growth rate projection.
  • New Acquisitions, Collaborations, or Partnerships: We keep a close watch on any new acquisitions, collaborations, or partnerships within the industry. These developments can have a significant impact on market dynamics and competitiveness.
  • Macro and Micro Factors Analysis:A thorough examination of both macro-level factors (e.g., economic trends, regulatory changes) and micro-level factors (e.g., technological advancements, consumer preferences) that may influence the market during the forecast period.
  • End-User Sentiment Analysis: To understand the market from the end-user perspective, we conduct sentiment analysis. This involves assessing the sentiment, preferences, and feedback of the end-users, which can provide valuable insights into market trends.
  • Perspective of Primary Participants: Insights gathered directly from primary research participants play a crucial role in shaping our forecasts. Their perspectives and experiences provide valuable qualitative data.
  • Year-on-Year Growth Trend: We utilize a year-on-year growth trend based on historical market growth and expected future trends. This helps in formulating our growth projections, aligning them with the market’s historical performance.

Research process adopted by TNR involves multiple stages, including data collection, validation, quality checks, and presentation. It’s crucial that the data and information we provide add value to your existing market understanding and expertise. We have also established partnerships with business consulting, research, and survey organizations across regions and globally to collaborate on regional analysis and data validation, ensuring the highest level of accuracy and reliability in our reports.


Procure Comprehensive Study of

Global Synthetic Natural Gas Market

Online Only

  • Online Access
  • Read Only File
  • Validity 3 Months
  • Print, Copy, Paste & Download
  • PPT, Excel
  • Cost-Free Report in the Next Update
$3300
Buy Now

Single User

  • Access to One User on One System
  • Read Only File
  • Validity 6 Months
  • Limited Print,Copy, Paste
  • PPT, Excel
  • Cost-Free Report in the Next Update
$4200
Buy Now

Multi User

  • Access to Fiver Users
  • PDF File
  • Validity 1 Year
  • Upto FivePrints
  • Cost-Free Report in the Next Update
  • PPT, Excel
$6000
Buy Now

Enterprise User

  • Access to Unlimited Users
  • PDF, PPT, Excel
  • Unlimited Validity, Prints&Downloads
  • 1 Hour Cost-Free & Dedicated Analyst Support
  • 10% Cost-Free Customization
  • Cost-Free Report Update Twice in a Year
  • Recommendations for Business Strategies
  • Authorization to Quote TNR, The Niche Research
$7300
Buy Now

Library Access

  • Online Access to Content Publications
  • Access Player Profiles Online
  • Get Immediate Access to Newly Added Content
  • Acquire 12 PDF Downloads
  • Acquire 5 Excel Data Sets
  • Gain Access to 290+ PDFs of Company Profiles
  • Round-the-clock Email and Phone Assistance
  • Dashboard Usage and Trends
  • Renewal & Upgrade Assistance
  • Assessing Customization Options and Alerts for New Reports
$10788
Buy Now
*Taxes/Fees, if applicable will be added during checkout. All prices in USD

Why TNR The Niche Research?

  • Unwavering Commitment to Excellence

  • Veteran Team of Researchers

  • Accurate and Timely Insights

  • Ethical Practices and Customized Service

  • Uninterrupted Availability Around the Clock

Scroll to Top